
Features
Organized by what you want to do. Each item links to the user manual. See the Window Reference for each window.
Observe the bus
| Feature | Description | Manual |
|---|---|---|
| Trace | Scrolling or event view of CAN, LIN and MeLiBu traffic, with signal decoding, filters and triggers | Trace |
| Signal graph | Signals in separate lanes, with measurement cursors, CSV export and recorded log viewing | Trace |
| Bus statistics | Bus load, frame rate, frame types, error classes and per-ID cycle times | Trace |
| CAN errors | Errors appear as separate events with reason and error counters | Troubleshooting |
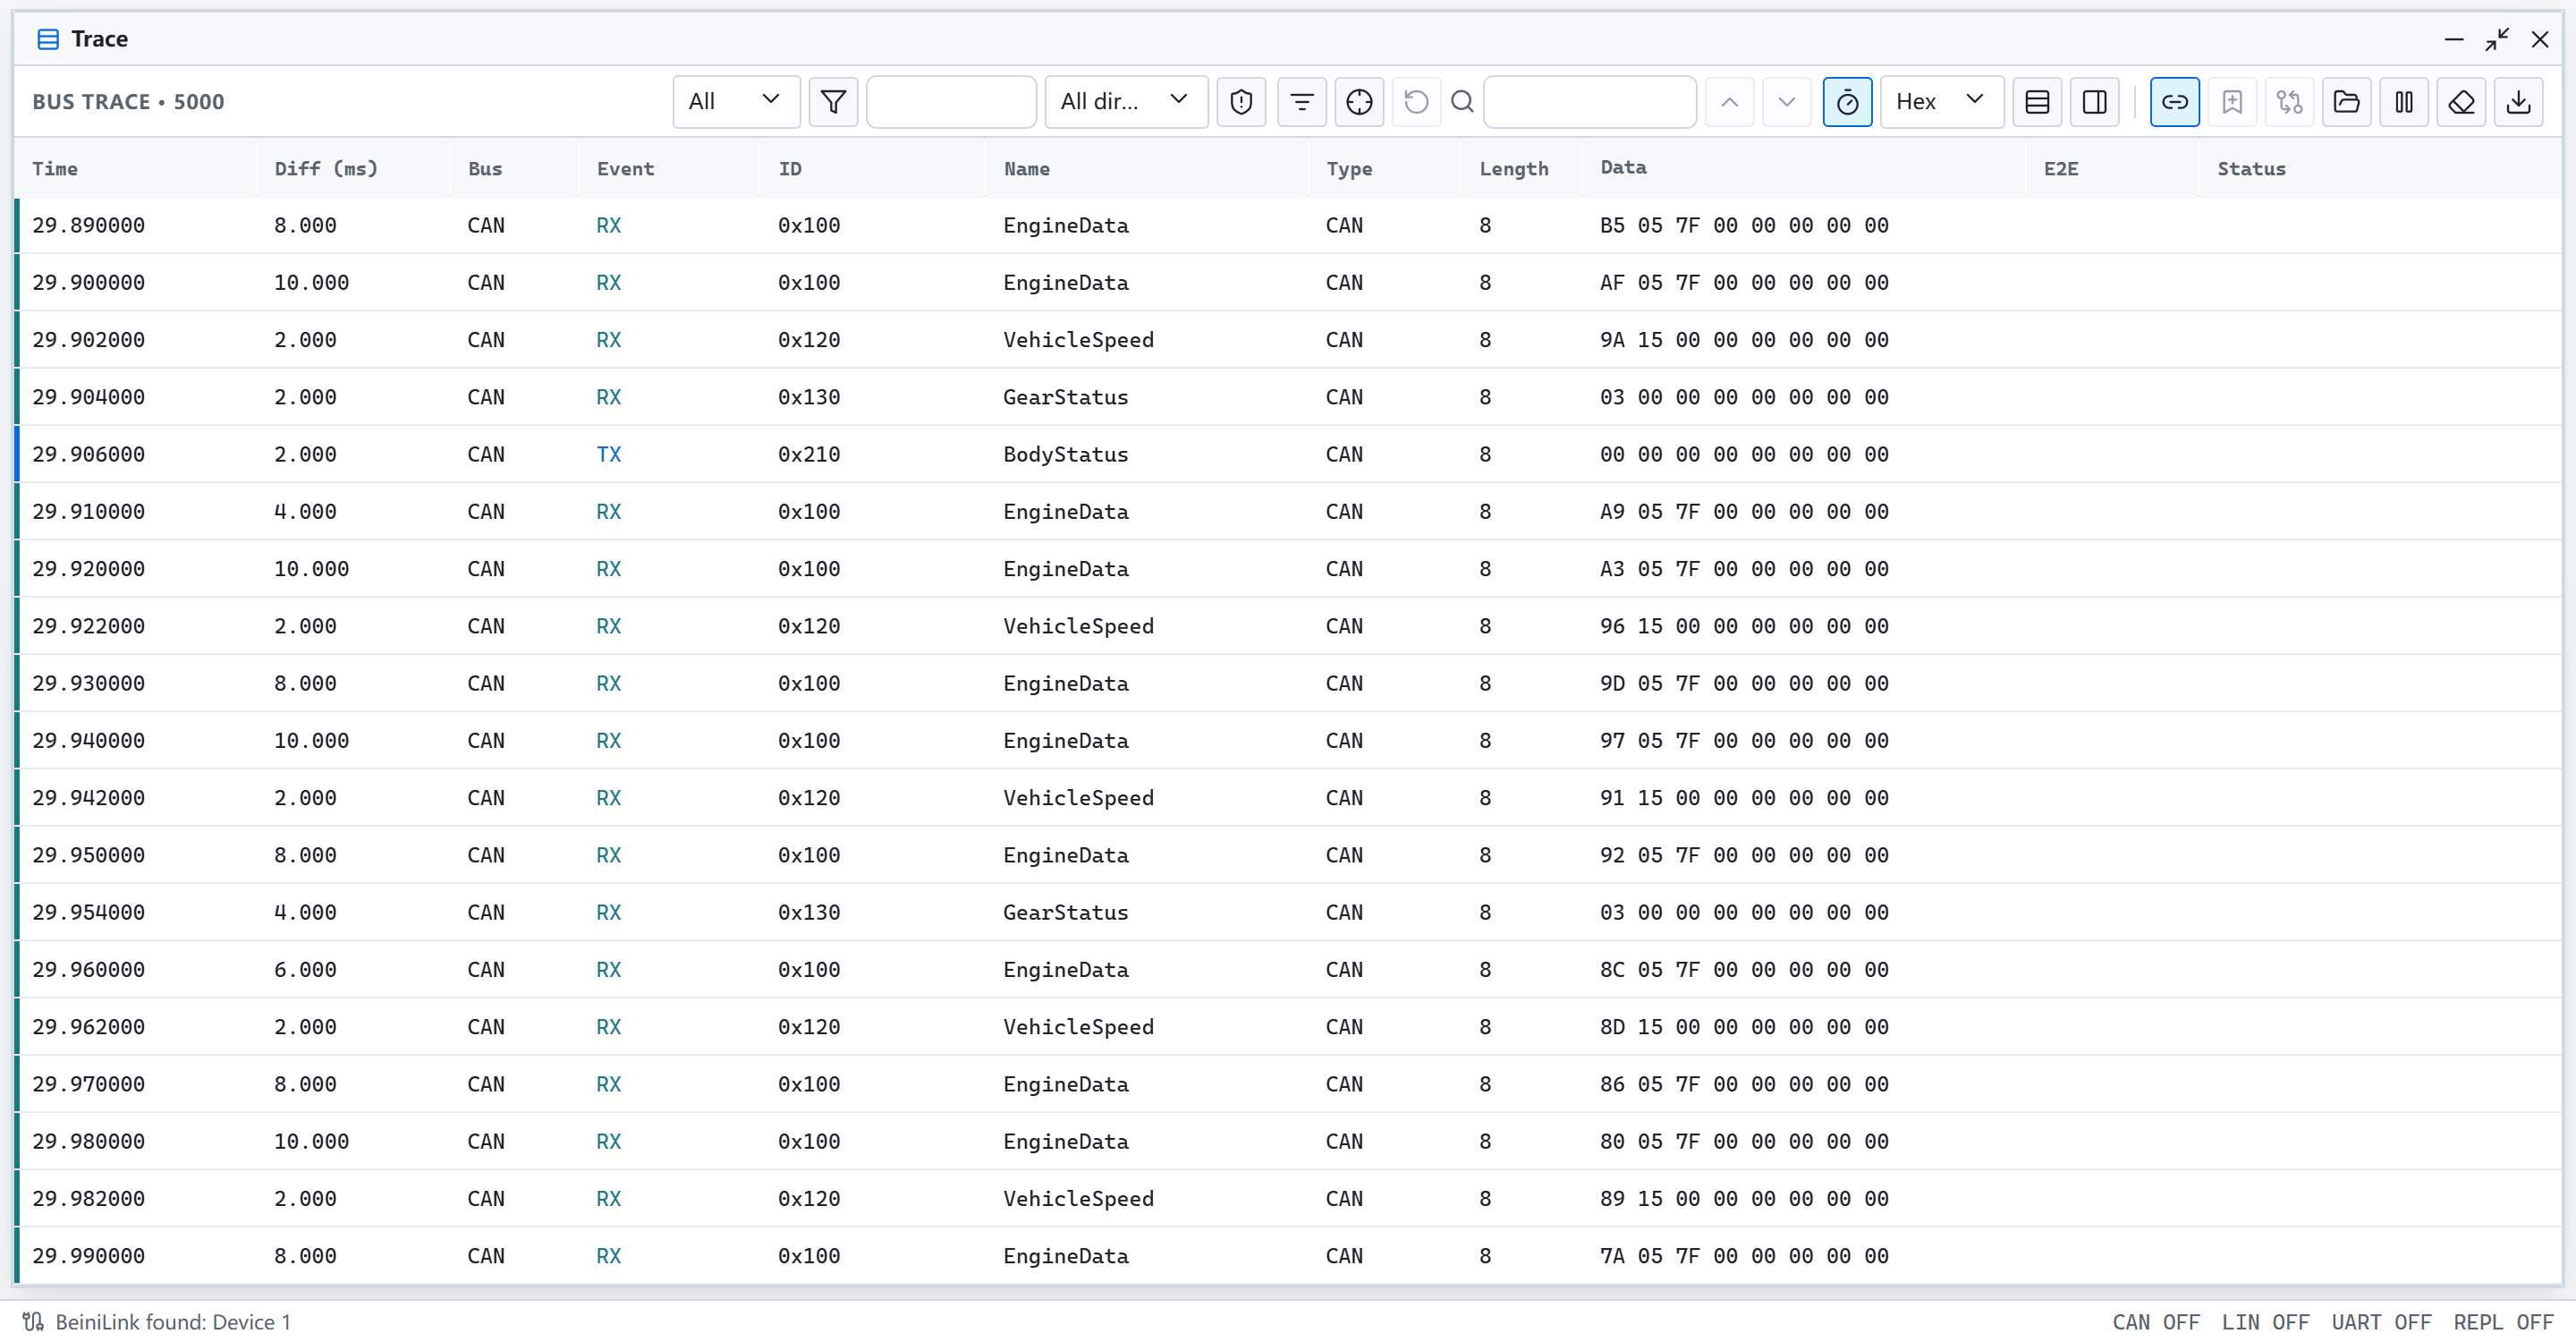
Trace: CAN and LIN frames over time, with message names from a DBC and filters by ID, direction and content
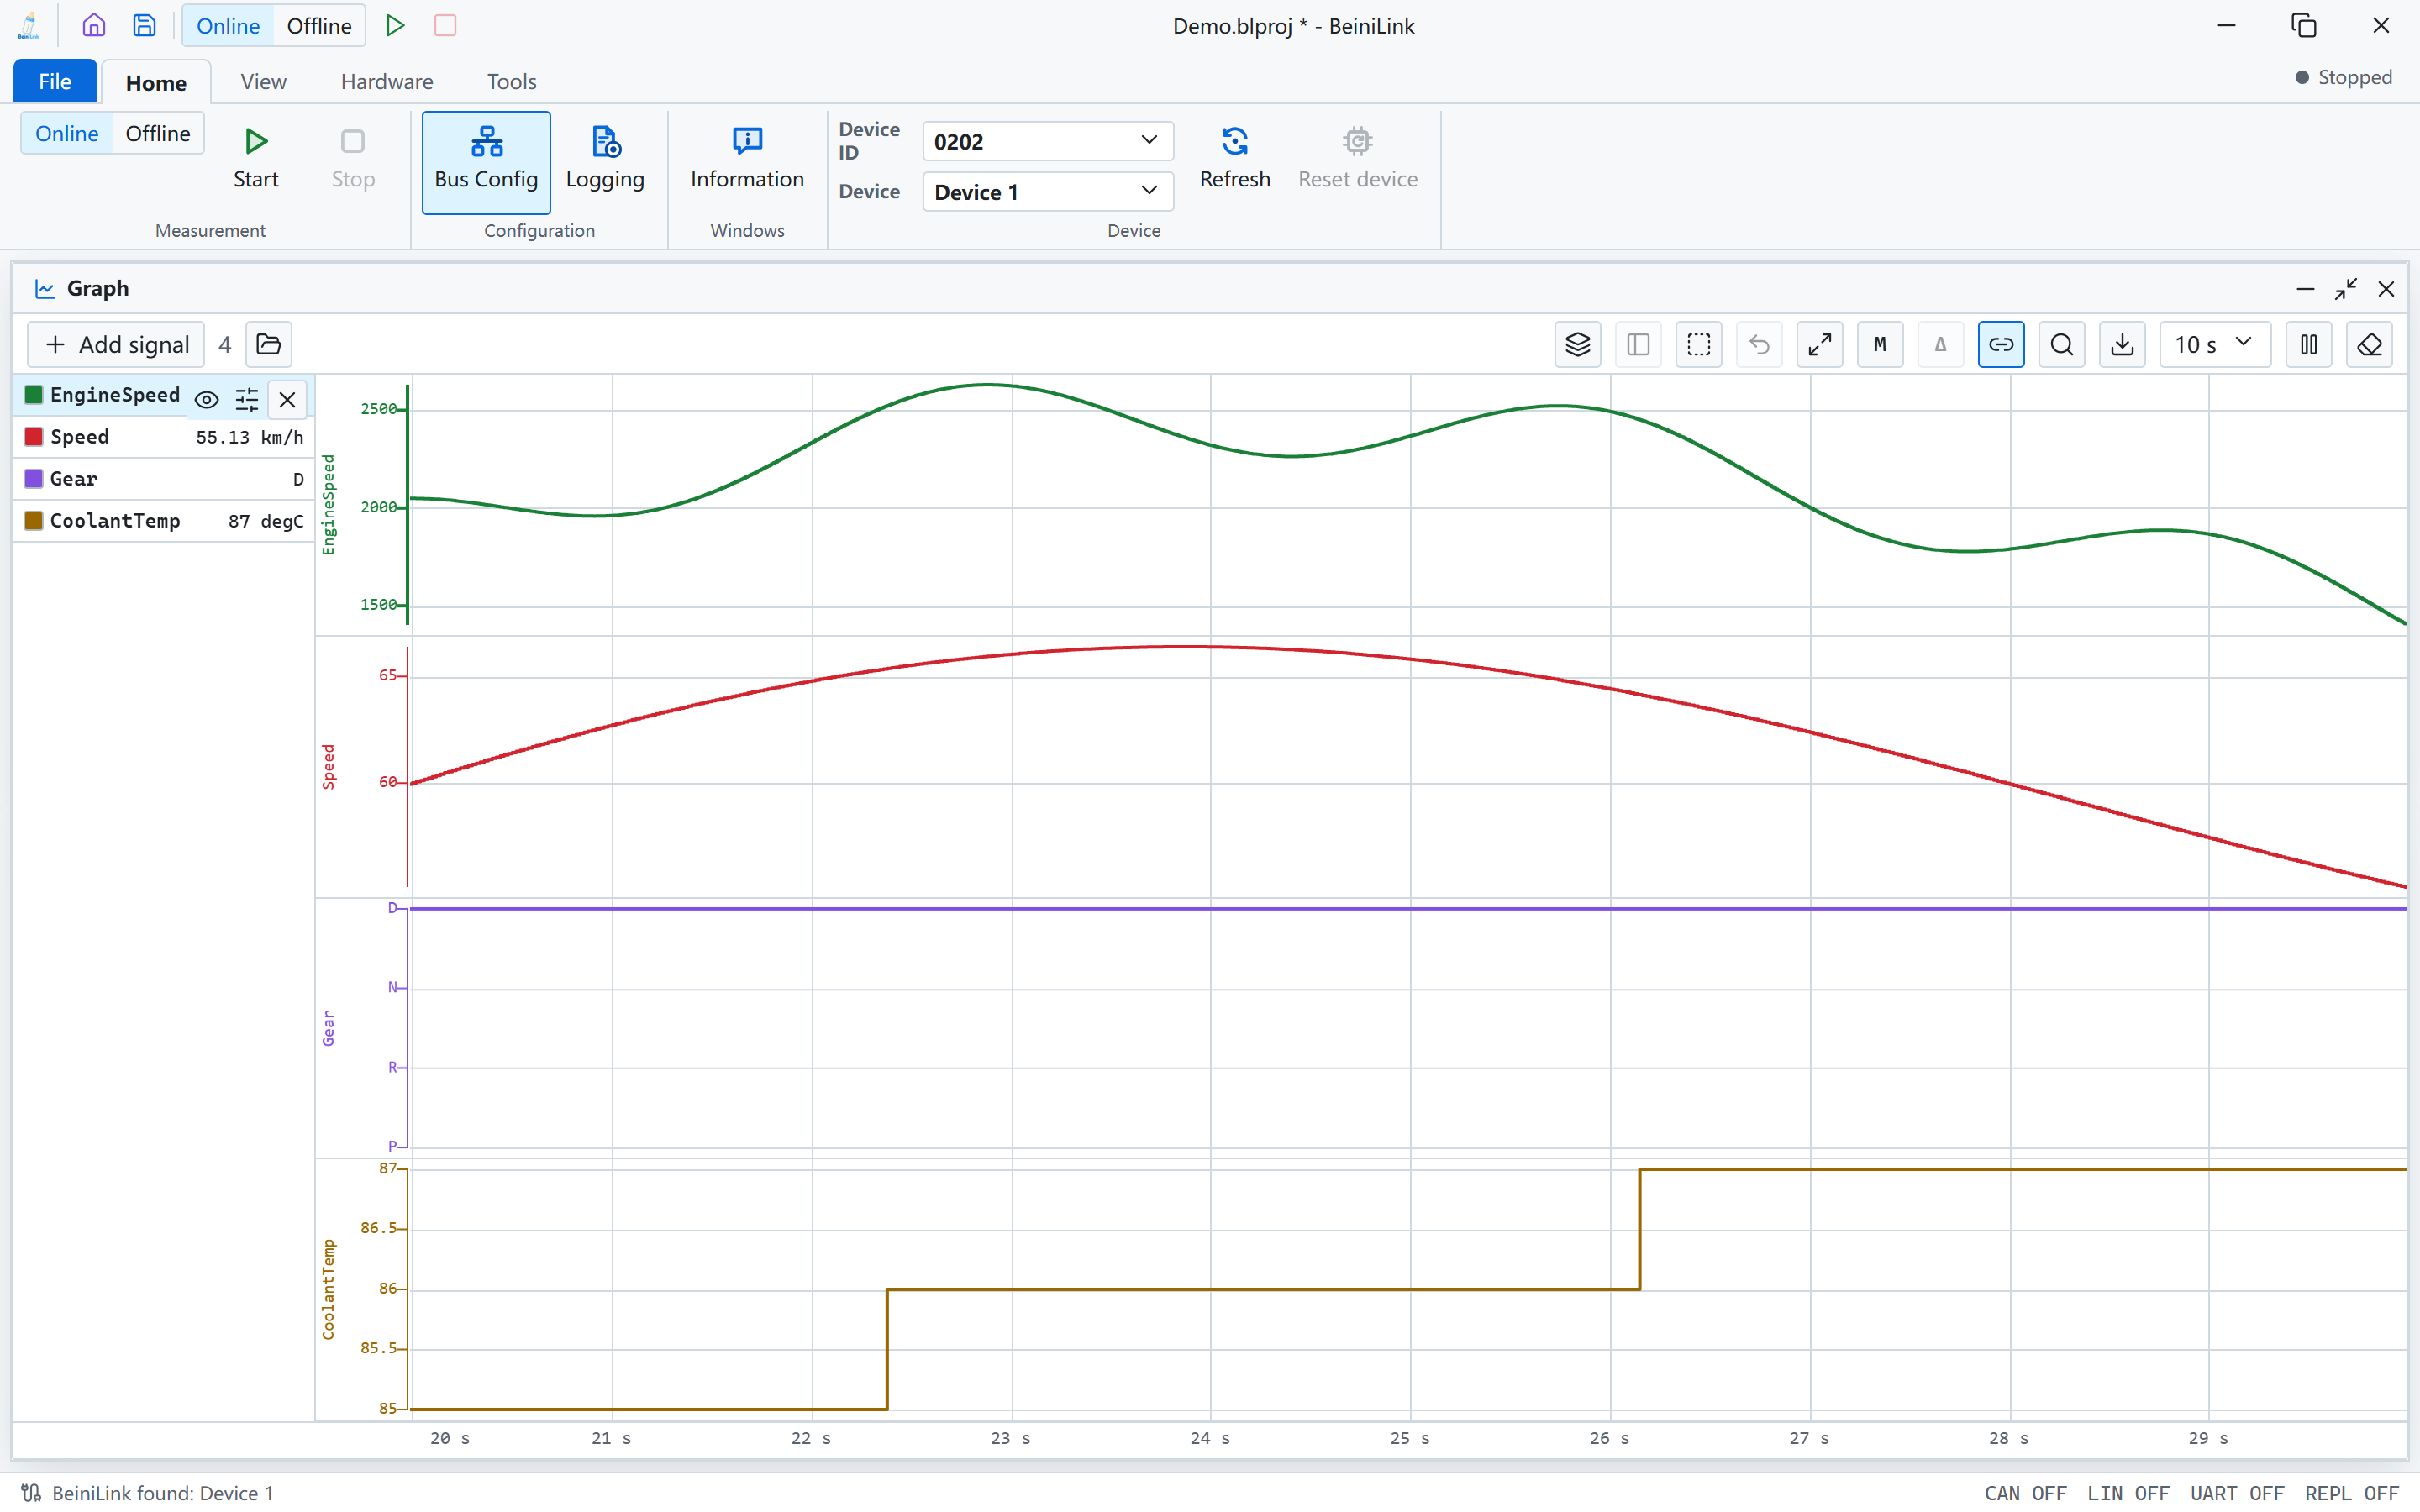
Signal graph: physical values and enum states in separate lanes, current values on the left, with measurement cursors and CSV export
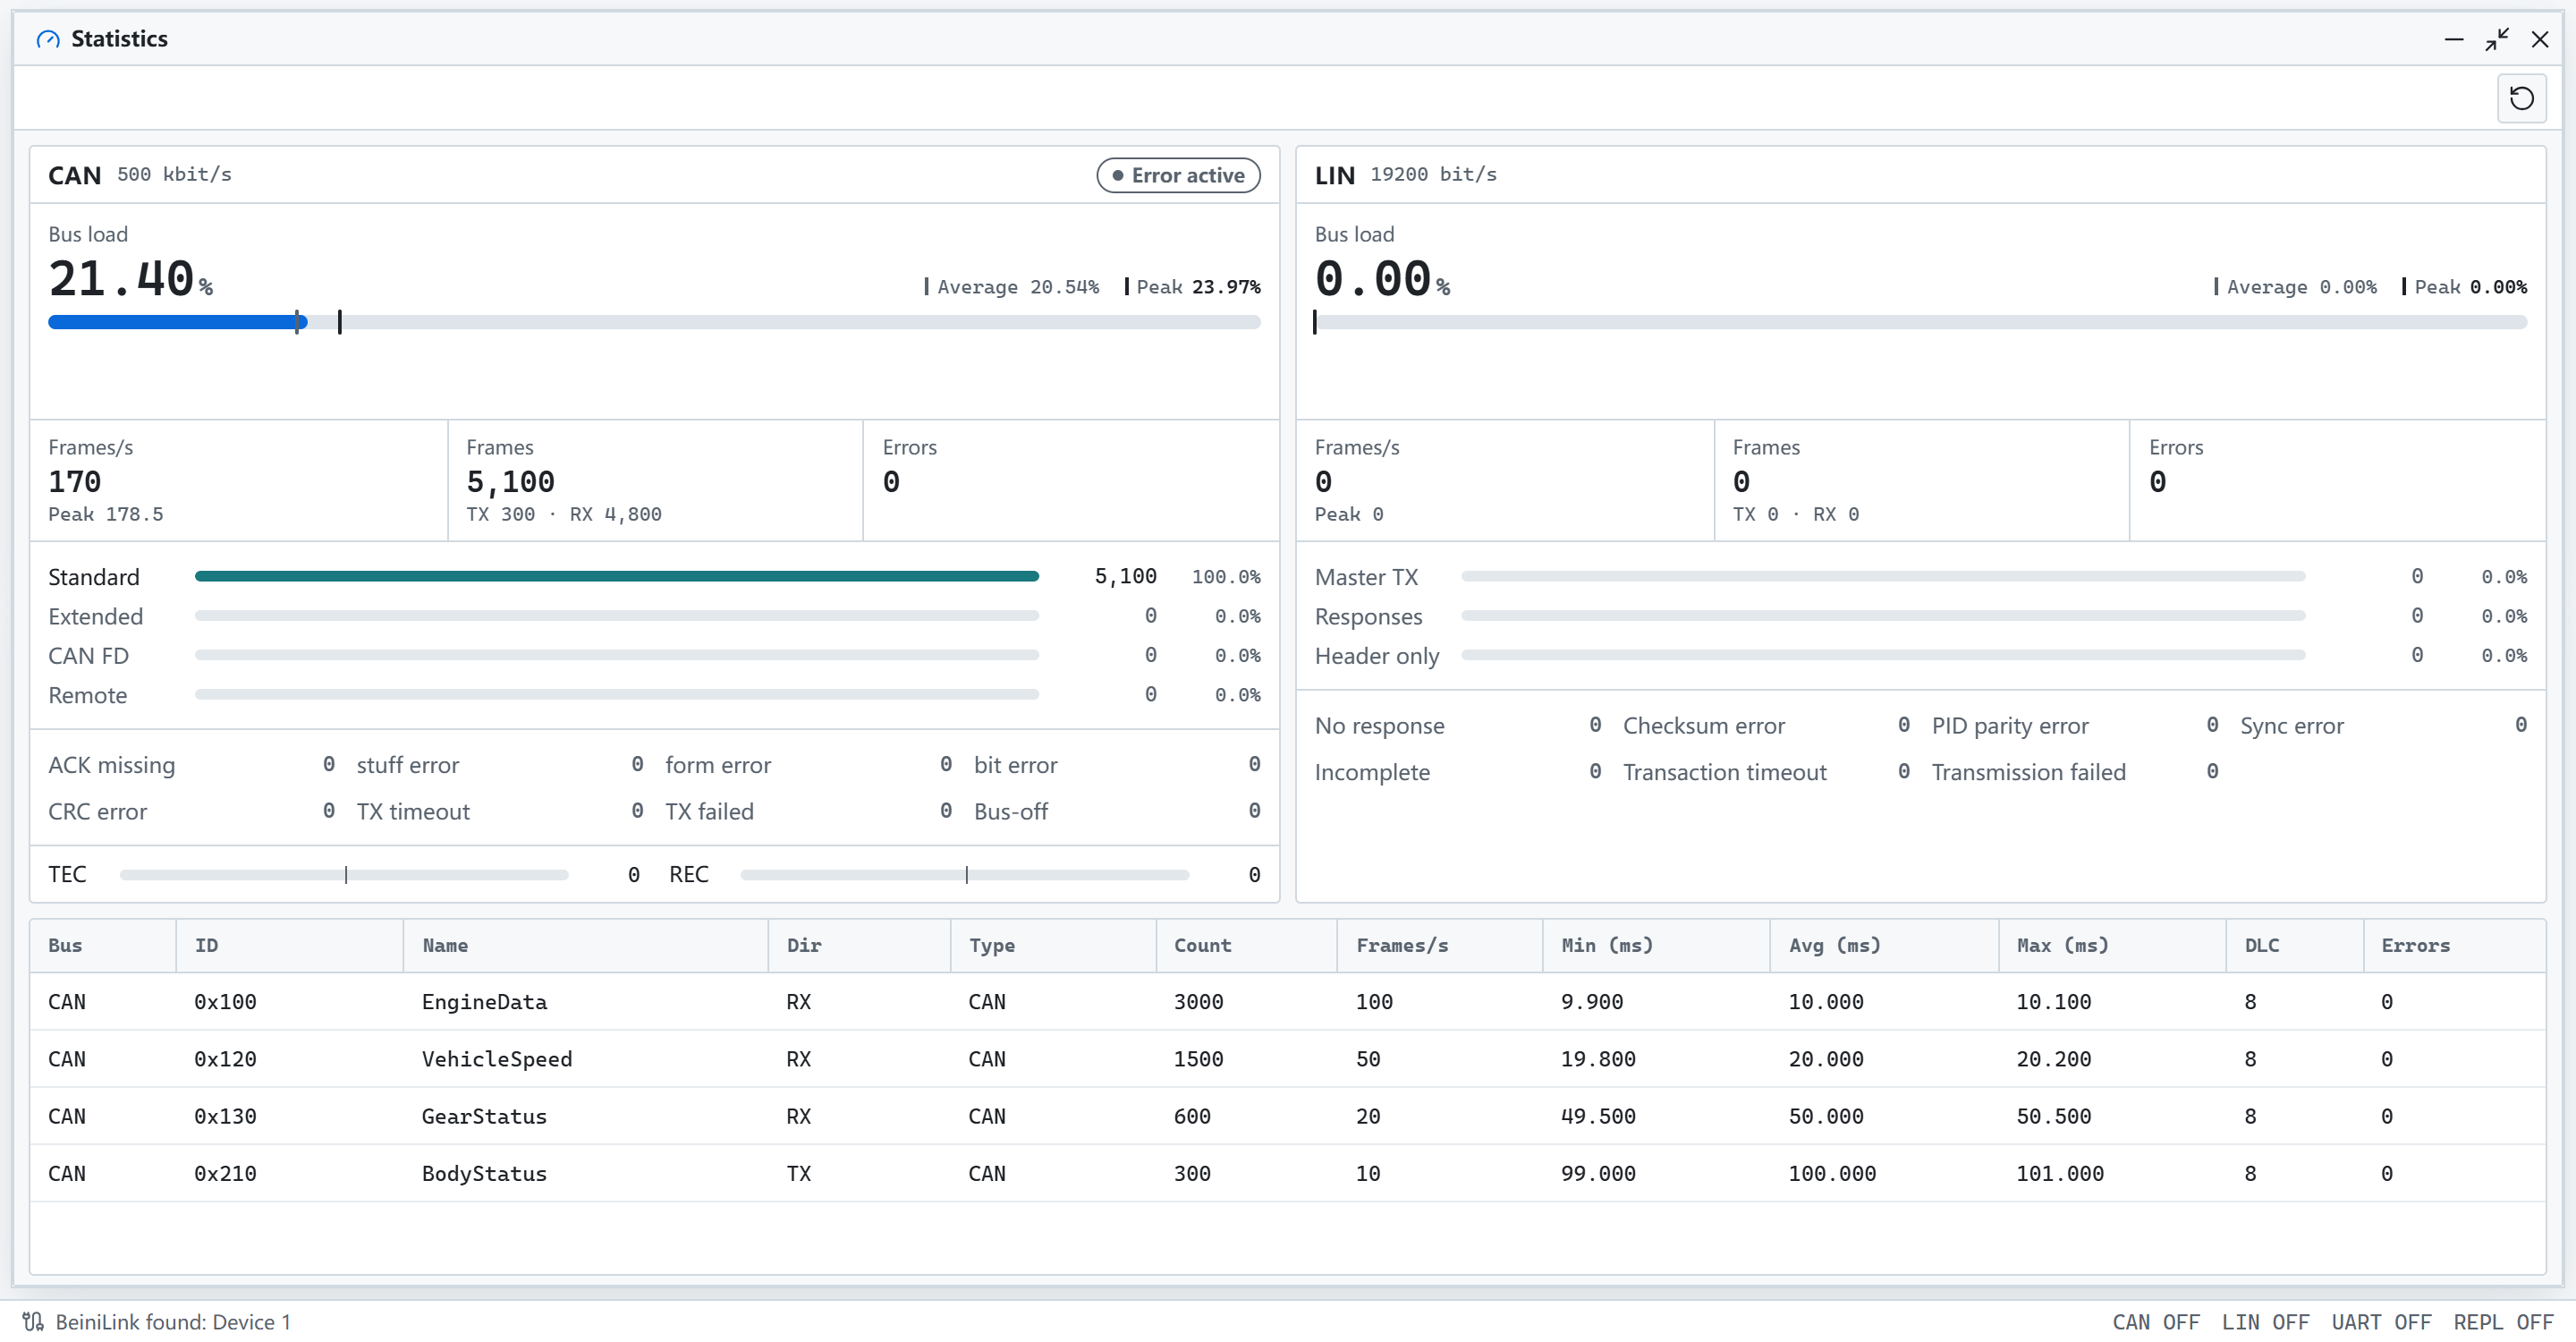
Bus statistics: load, frame rate, frame types and error classes, with cycle times per ID
Simulate nodes
| Feature | Description | Manual |
|---|---|---|
| CAN send | Manual or periodic transmit, with messages added from a DBC and edited by signal | CAN |
| Node simulation | Simulate nodes and periodic messages from a DBC or LDF | Bus configuration |
| LIN master | Custom or LDF schedules, including event-triggered and sporadic frames | LIN |
| LIN slave | Response table and bus monitoring | LIN |
| MeLiBu send | Import an MBDF, edit frames by signal and preview the encoding | PC Scripts |
| MeLiBu schedule | Run MBDF schedules or .mbdfscr scripts with progress and timing deviation | PC Scripts |
| E2E | CAN transmit protection and CAN and LIN receive checks, with AUTOSAR Profiles 1, 2, 5, 6, 11, 22 and custom CRC | Window Reference |

CAN send: set ID, length, period and data, then send manually or periodically
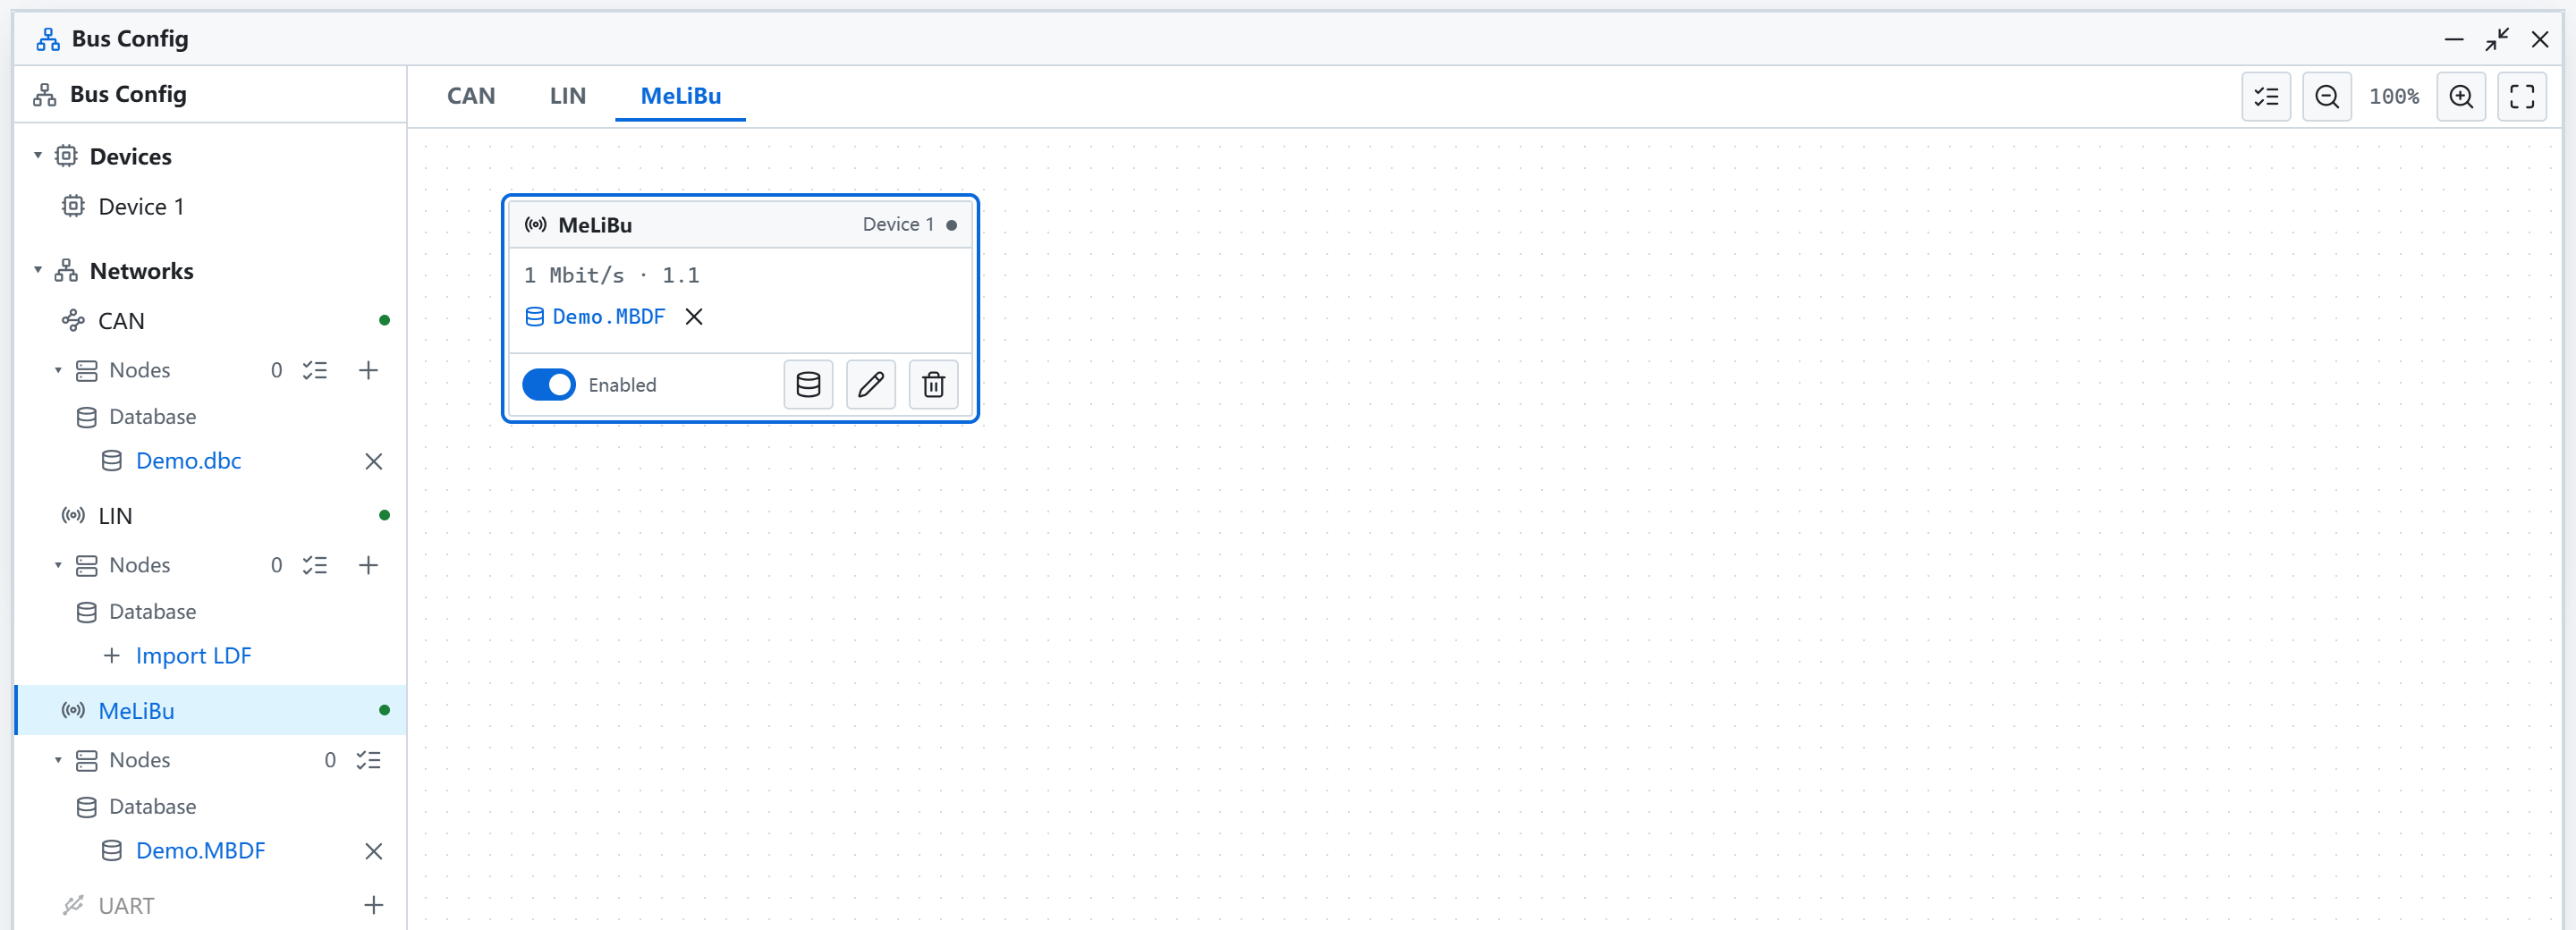
Bus configuration: manage CAN, LIN, MeLiBu and other interfaces, and bind DBC, LDF, MBDF files and nodes
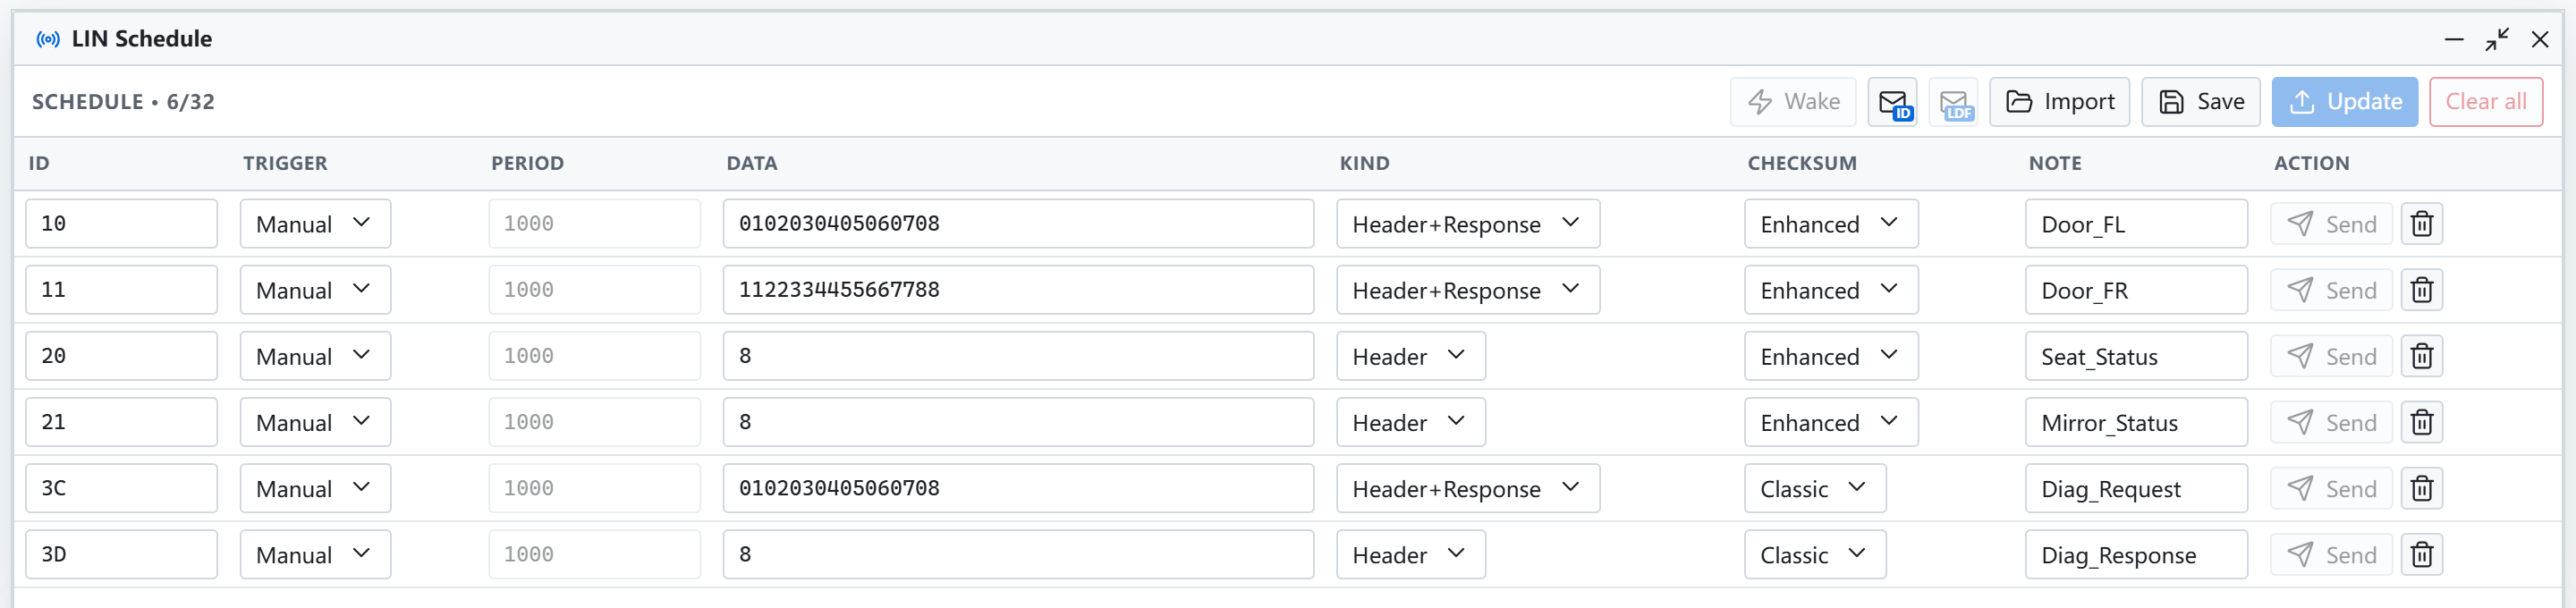
LIN schedule: configure headers and responses from a custom or LDF schedule

MeLiBu schedule: run MBDF schedules or scripts with order and timing listed
Log and replay
| Feature | Description | Manual |
|---|---|---|
| Logging | Bus logs in BLF and ASC, UART logs as text | Logging |
| Online replay | Send a log onto the bus with its original timing | Replay |
| Offline analysis | Replay a log into Trace and graphs without a device | Replay |
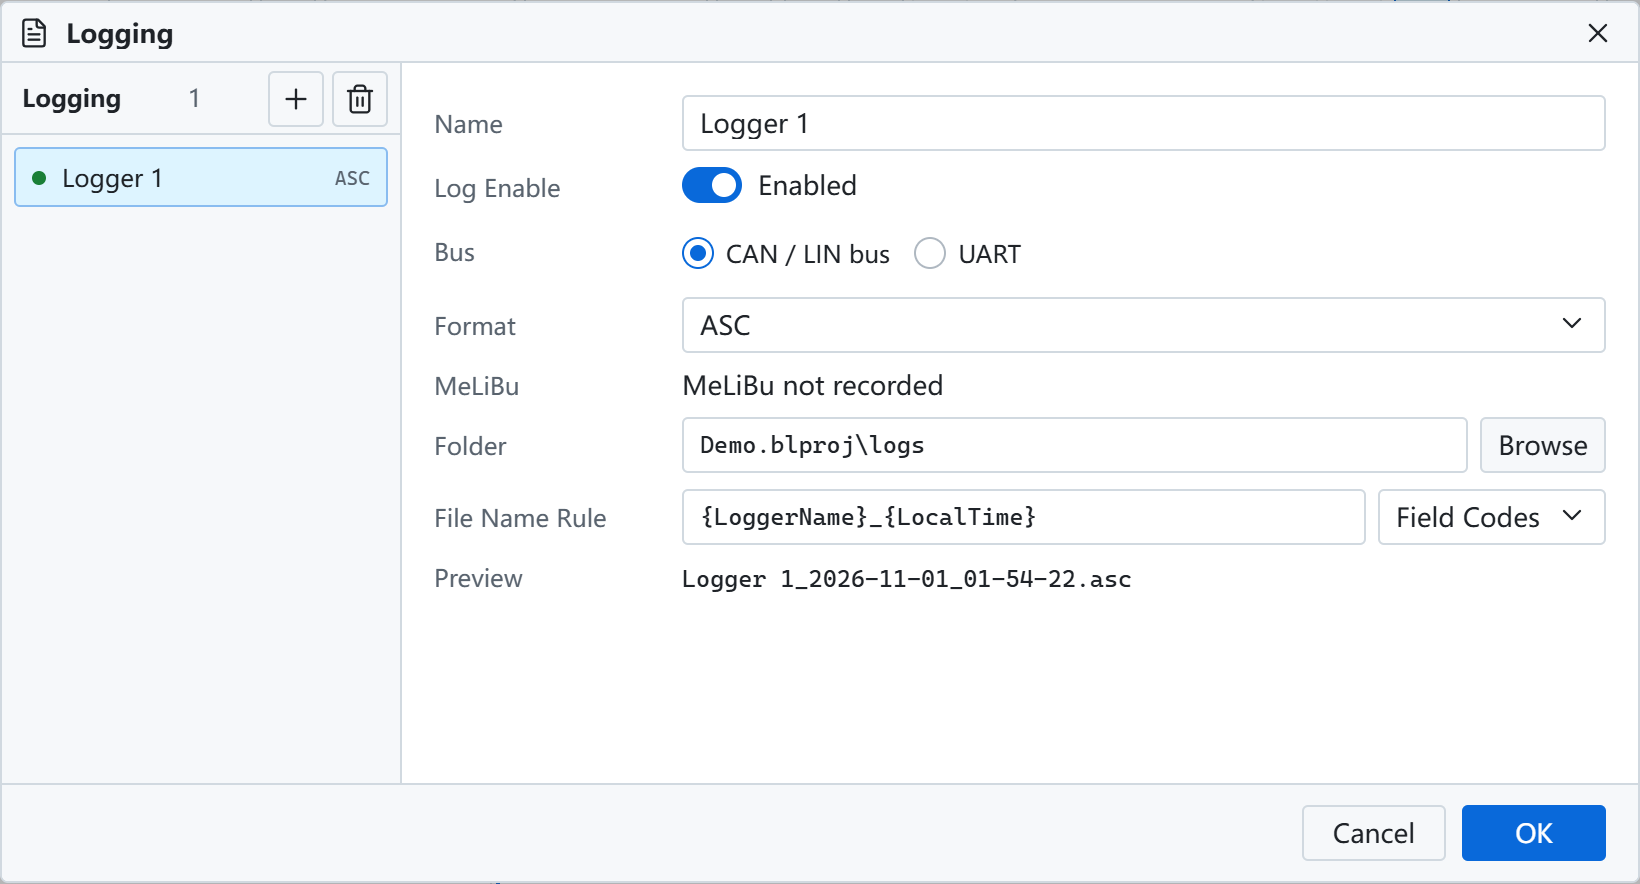
Logging: choose buses, output folder and file name rules
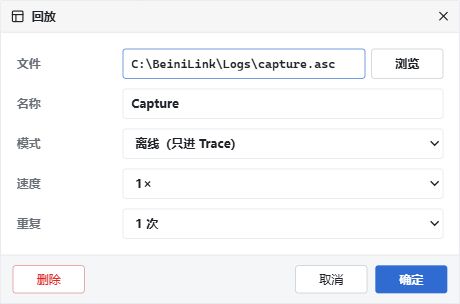
Replay: choose a log file and range, then send it online or analyze it offline
Automate
| Feature | Description | Manual |
|---|---|---|
| Variables | Project variables, with CANoe .vsysvar import and export | Variables |
| Panels | Control panels bound to signals and variables, with CANoe .xvp import | Panels |
| PC scripts | TypeScript or JavaScript that reacts to frames and reads and writes signals and variables | PC Scripts |
| Device Python | Simple Python scripts on the device | Python |
| Programming and flashing | The device provides a CMSIS-DAP interface; Python scripts can load FLM algorithms to program target chips, and products with a built-in bootloader can be flashed over LIN, CAN or CAN FD | Flash an ECU |
| Command line | Drive the device from scripts and CI, with JSON output and exit codes | Developers |
| AI-assisted changes | AI tools change projects, control measurement and read Trace through MCP | Developers |
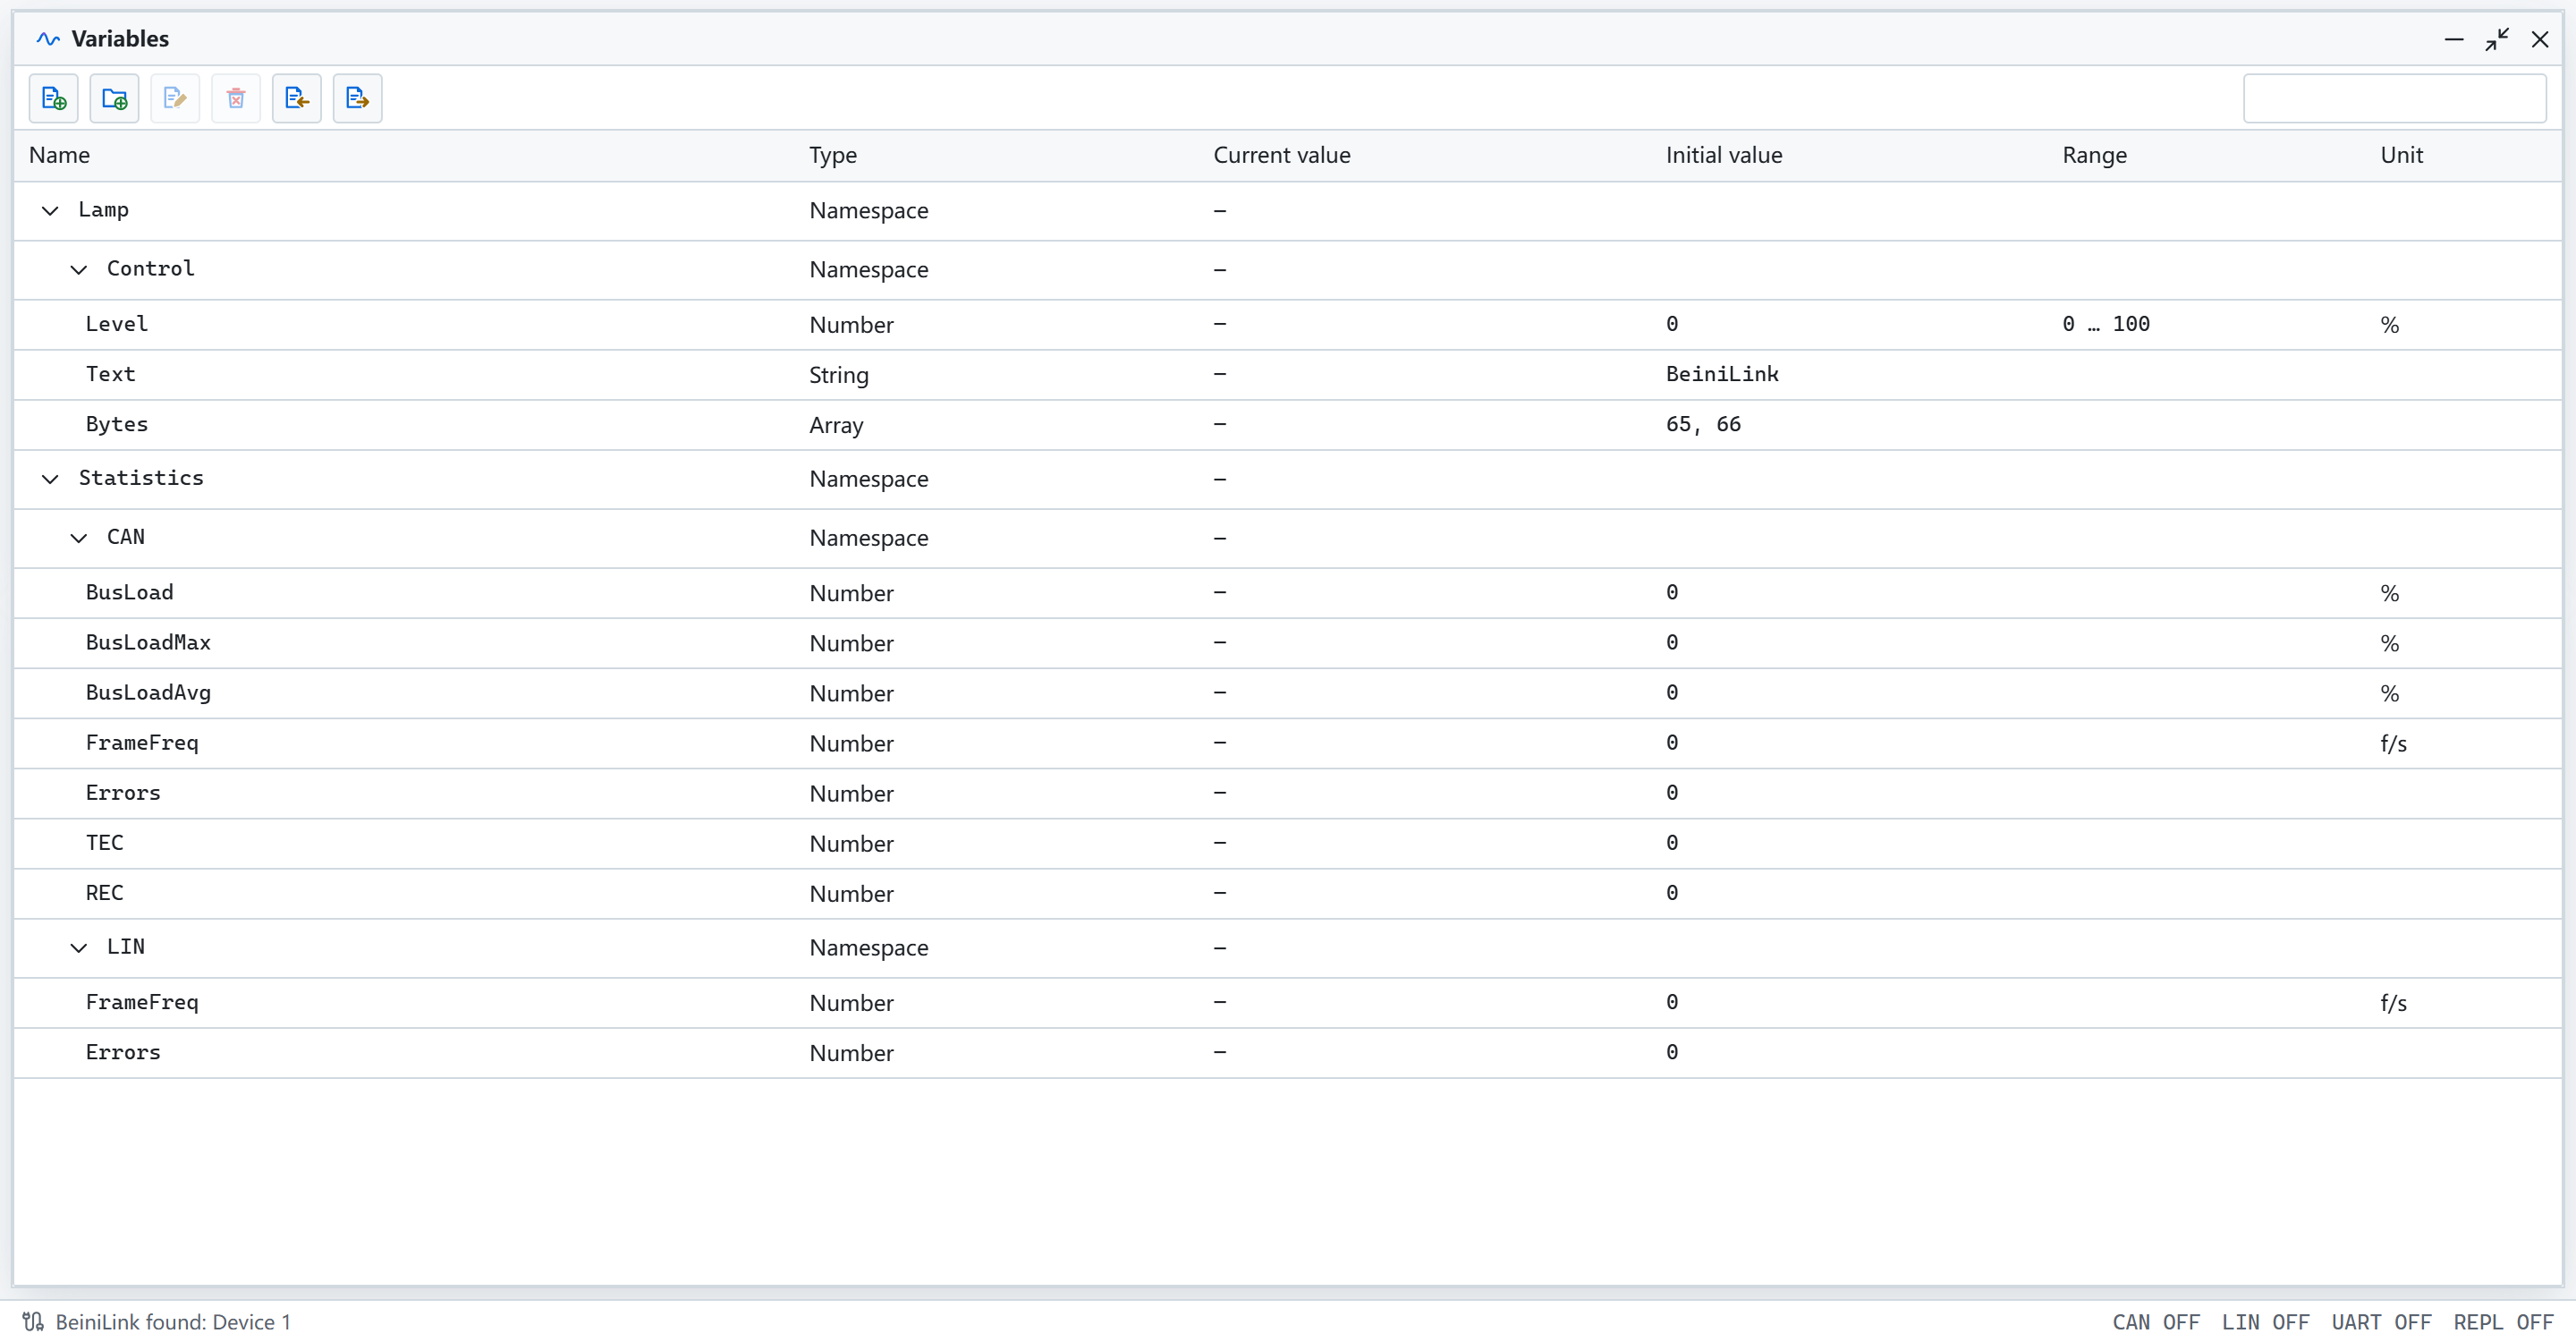
Variables: project variables by namespace, with CANoe variable file import and export
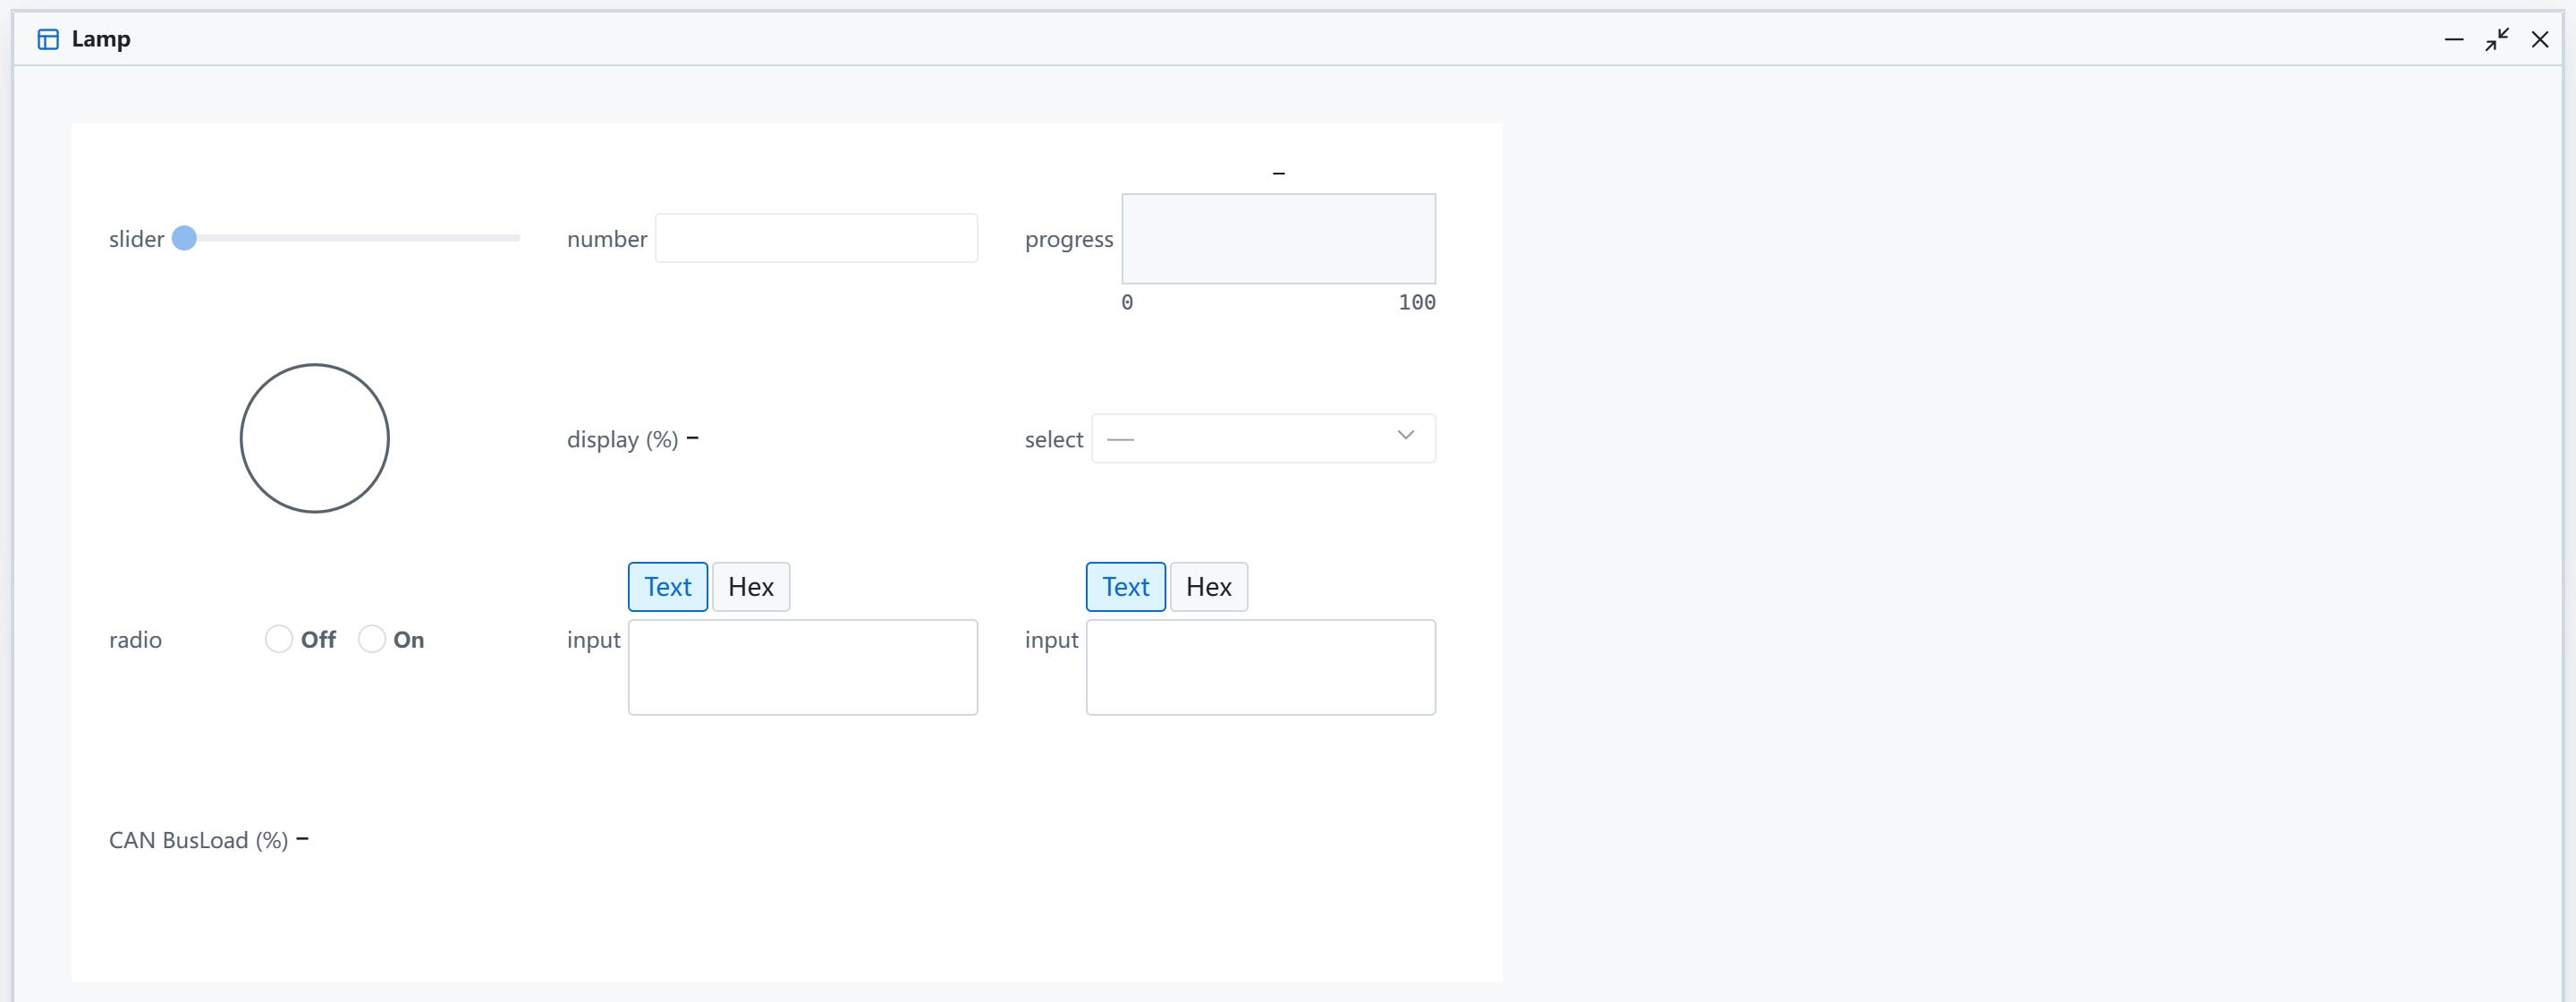
Panels: bind sliders, lamps and inputs to signals and variables
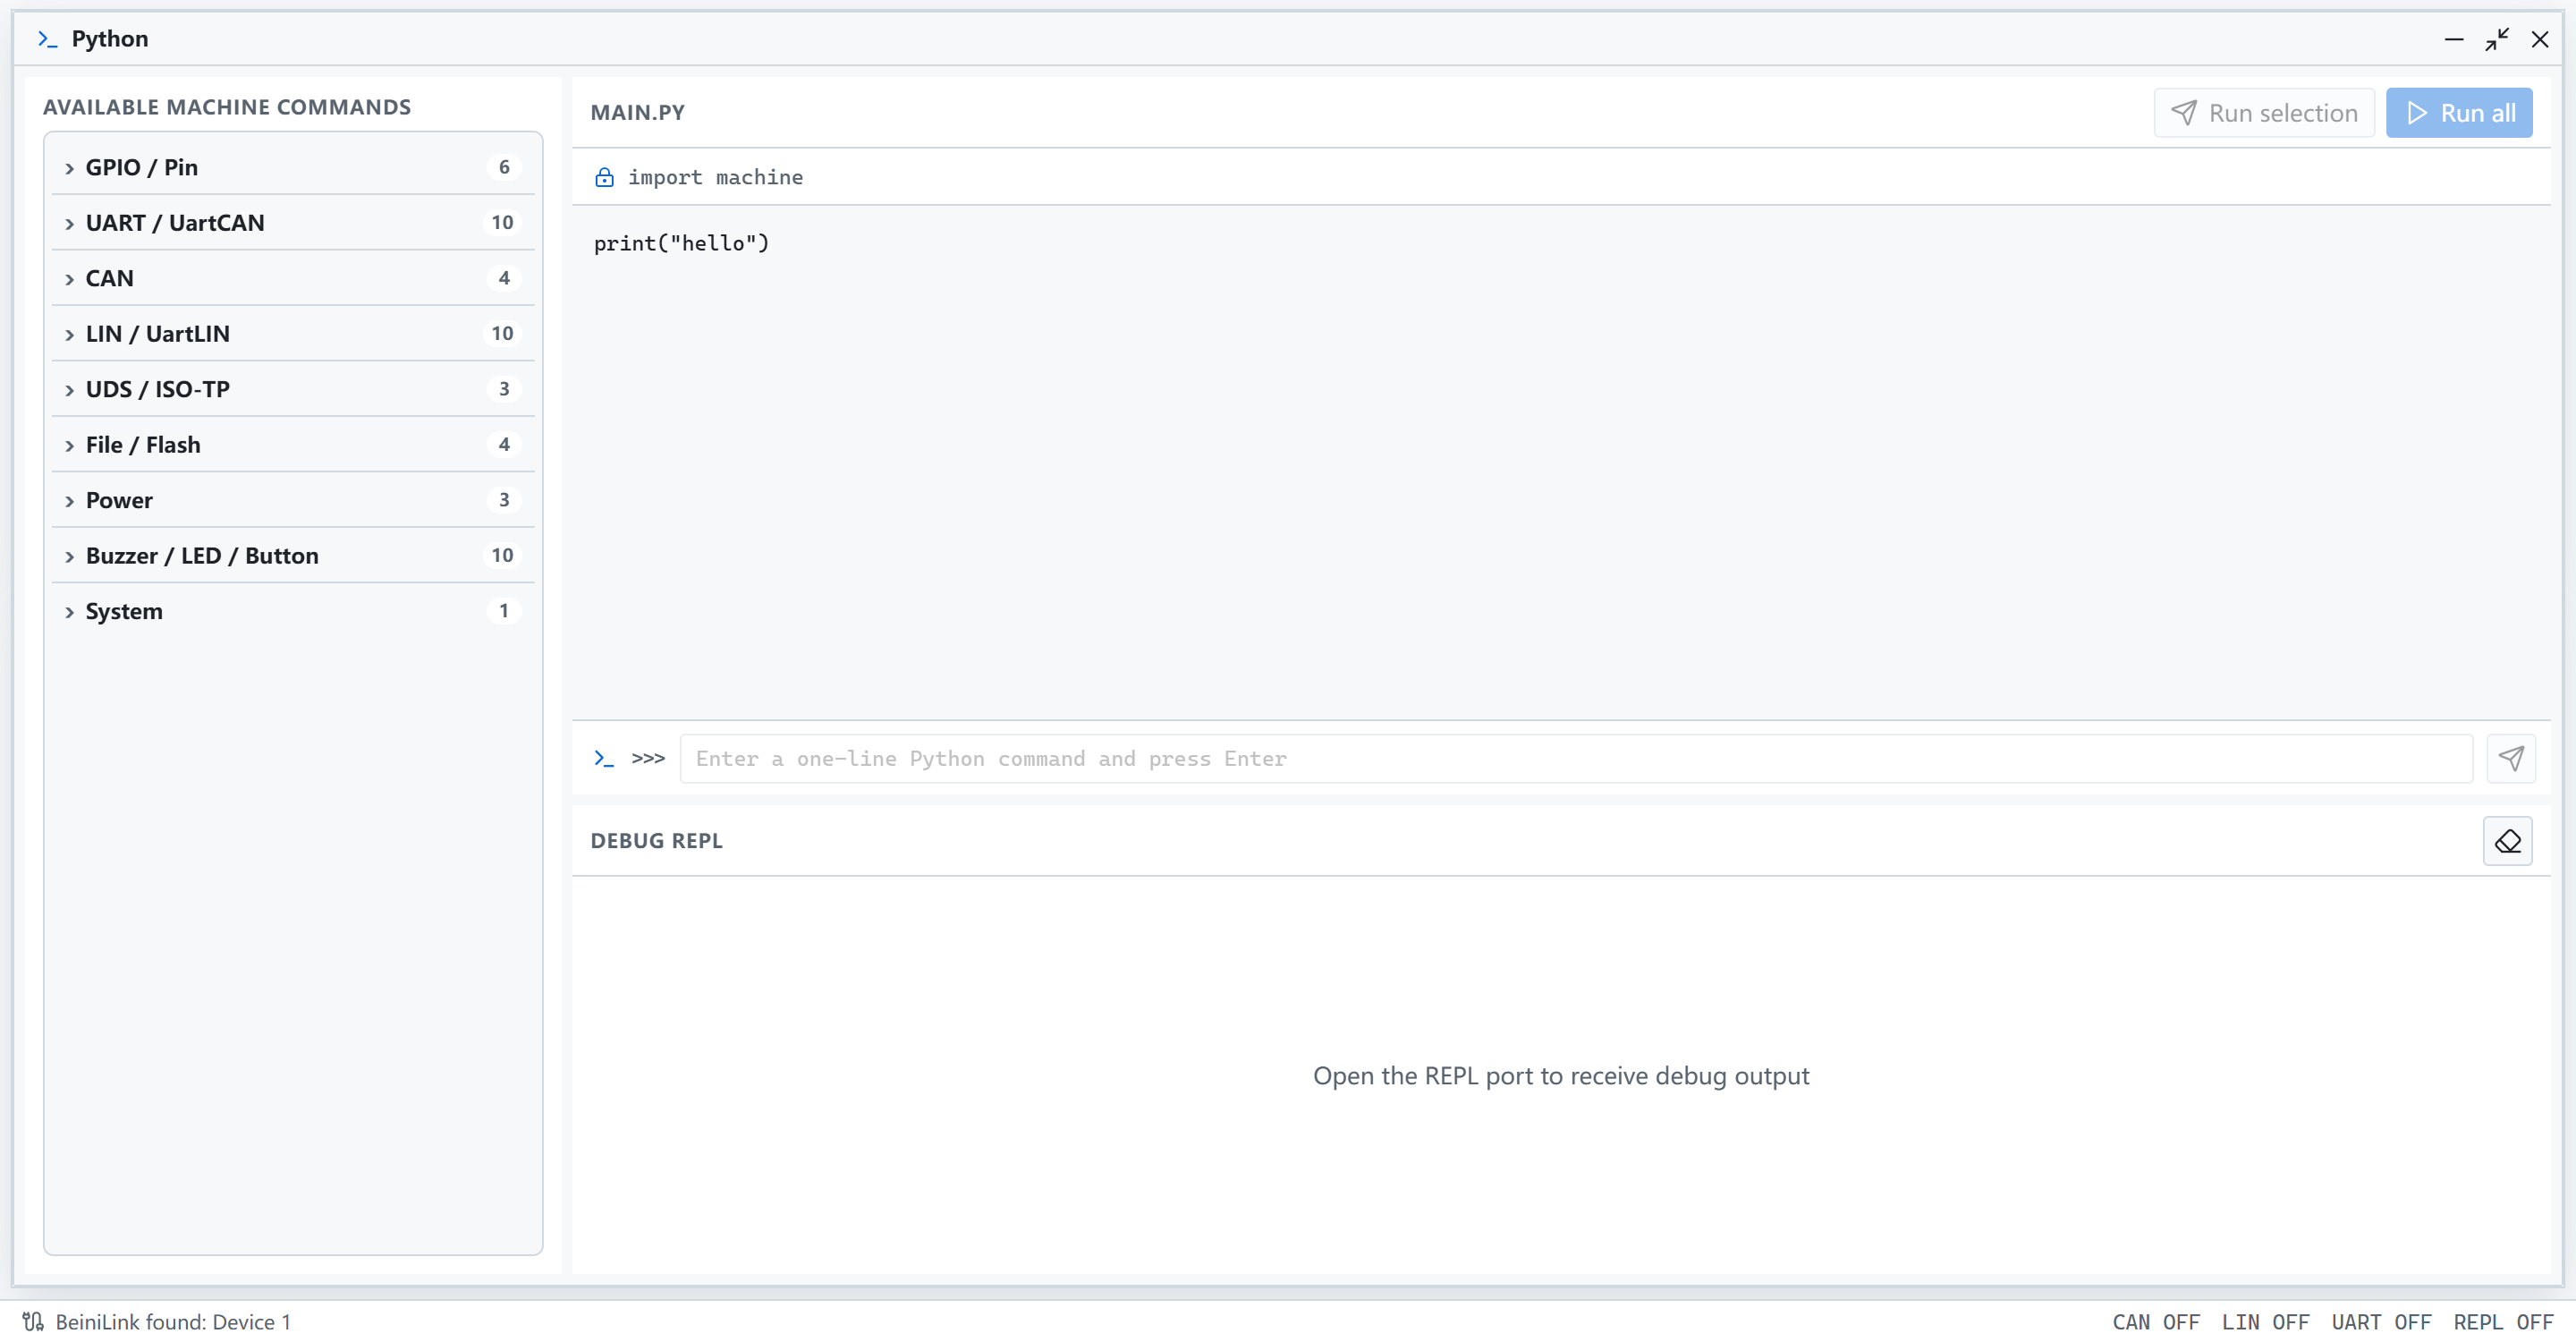
Python: device script editor and REPL, with the available API listed on the left
Tools
| Feature | Description | Manual |
|---|---|---|
| Code generation | Generate C interfaces from a DBC or LDF | Tools |
| Firmware conversion | Convert HEX, BIN and S19, and calculate or insert CRC32 and SHA256 | Tools |
| Log conversion | Convert between log formats | Tools |
| COM debug | Standalone serial debug window | Tools |
| Device firmware update | Check the firmware version and update it | Tools |
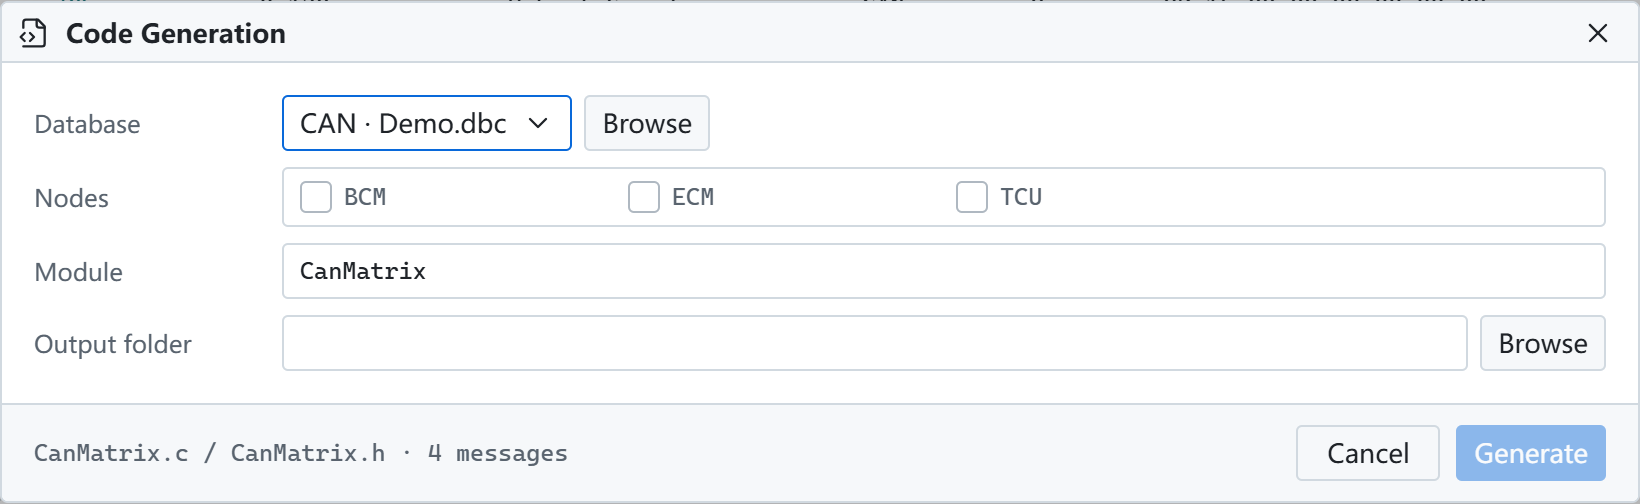
Code generation: generate C interfaces from a DBC or LDF
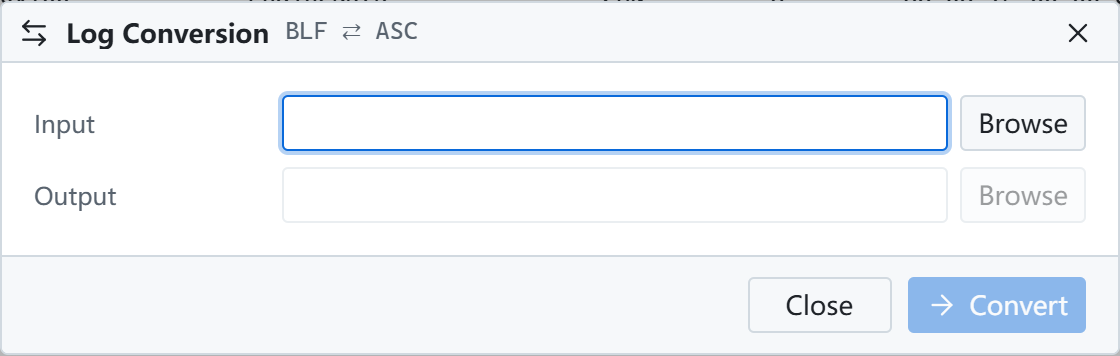
Log conversion: convert between BLF and ASC
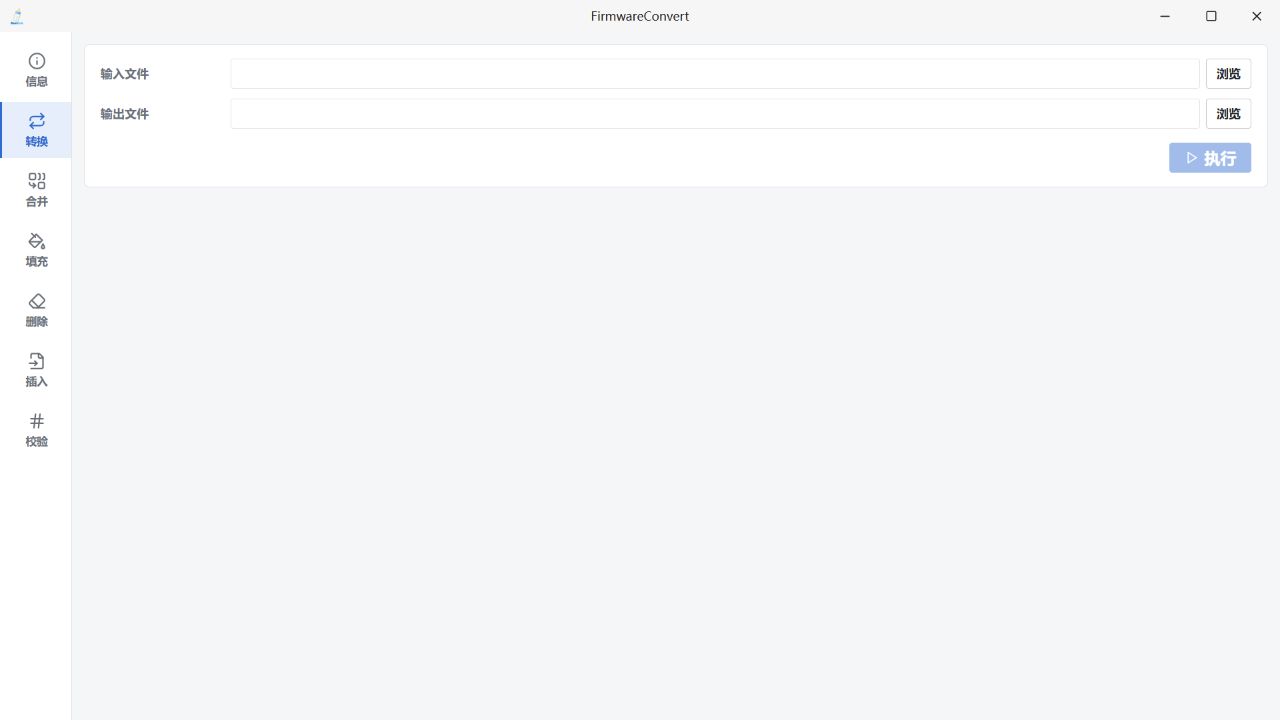
FirmwareConvert: convert HEX, BIN and S19, and calculate or insert checksums