
Window Reference
BeiniLink's features live in its windows. Analysis and send windows open from the View tab. Bus configuration, Logging and Information are on the Home tab, and conversion tools are on the Tools tab.

The View tab holds the analysis, send and design windows
Windows can be moved, docked, maximized, or popped out into their own window.
Bus Configuration
Add and manage device interfaces. This is the first step in using BeiniLink.
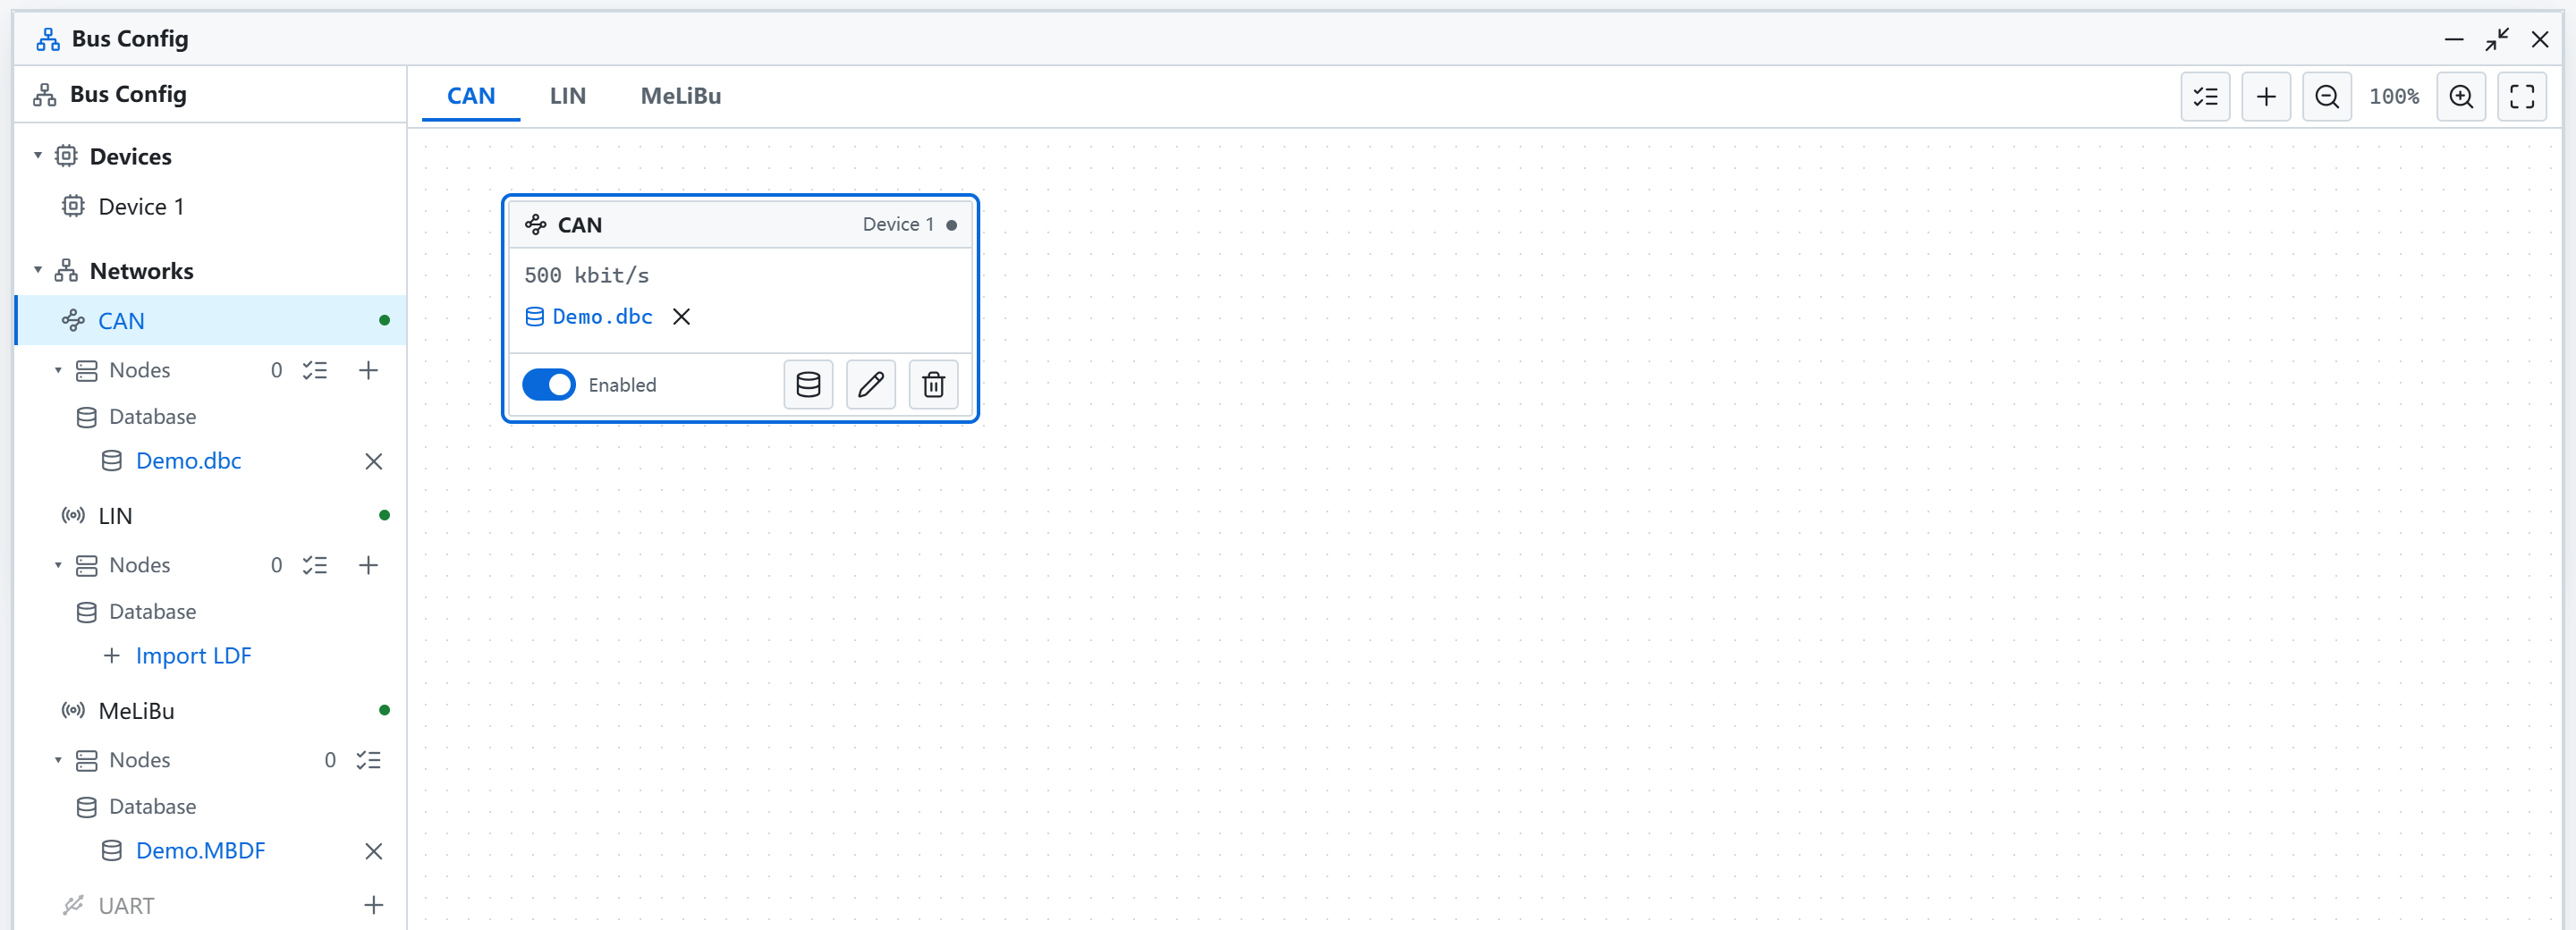
- Add CAN, LIN, MeLiBu, UART and other interfaces, and enable or disable them
- Bind DBC, LDF and MBDF databases
- Add nodes and configure node simulation and scripts
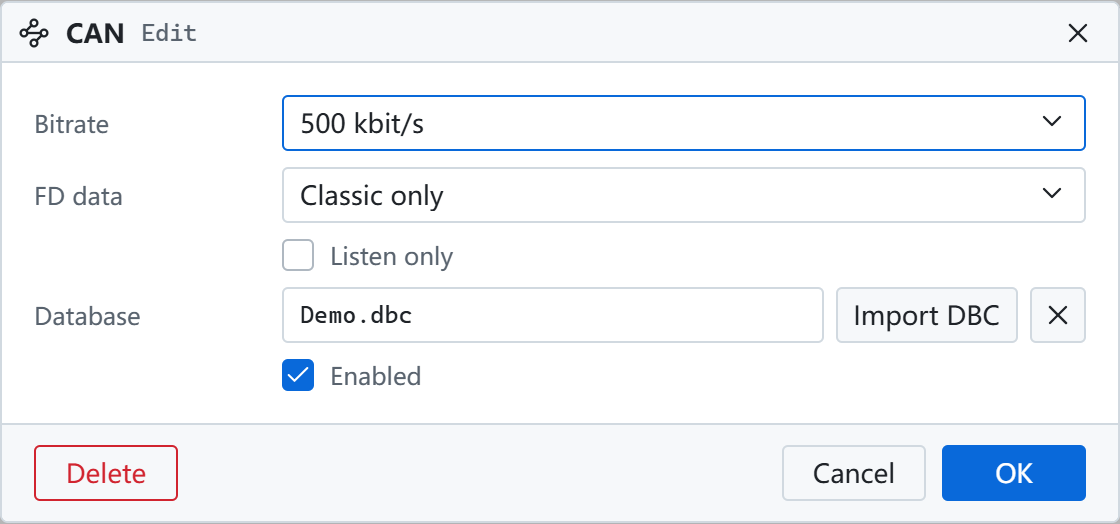
Click the edit button on an interface card to set its parameters:
E2E Configuration
Configures E2E protection and checks for CAN and LIN messages. In Bus Configuration, right-click a database and select E2E configuration.
- Selects a message and detects its CRC and counter signals from the database
- Supports AUTOSAR Profiles 1, 2, 5, 6, 11, 22 and custom CRC
- Fills in CRC and counter on CAN transmit, checks CAN and LIN on receive, and shows the result in Trace
Trace
Shows bus frames over time.
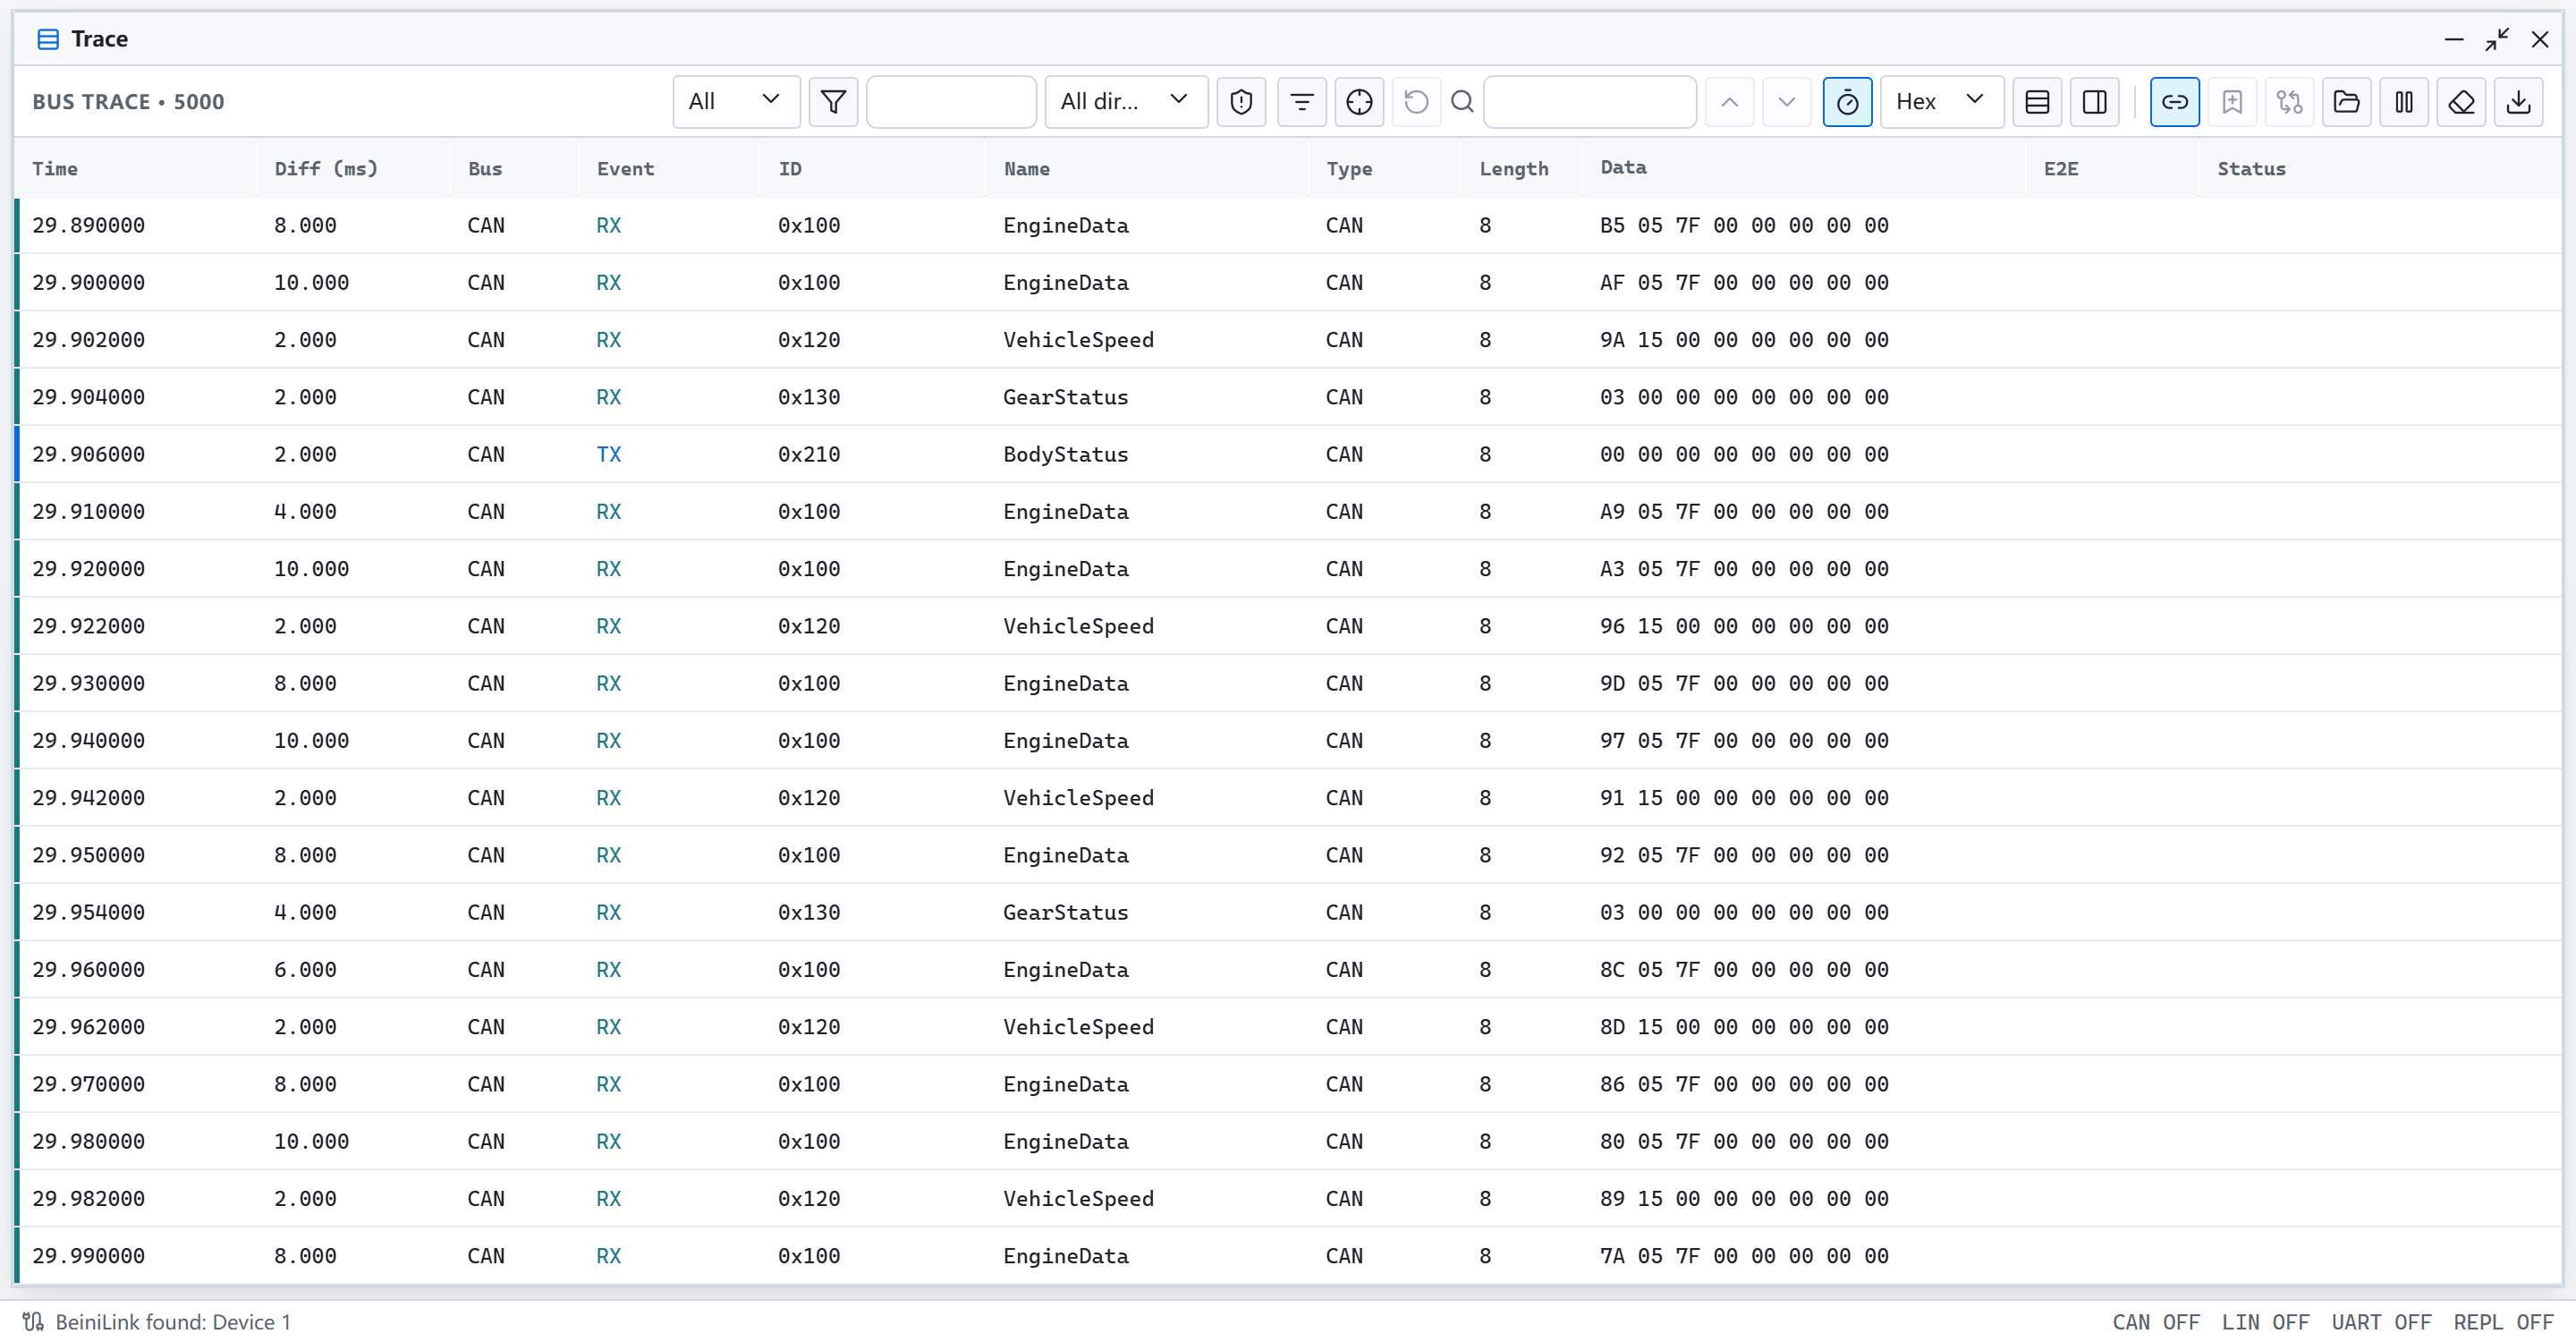
- Shows time, cycle, bus, direction, ID, name, length and data
- Shows message names and decodes signals once a database is loaded
- Offers scrolling and event views, with filters, search, triggers and export
See Trace.
Graph
Plots signals over time.
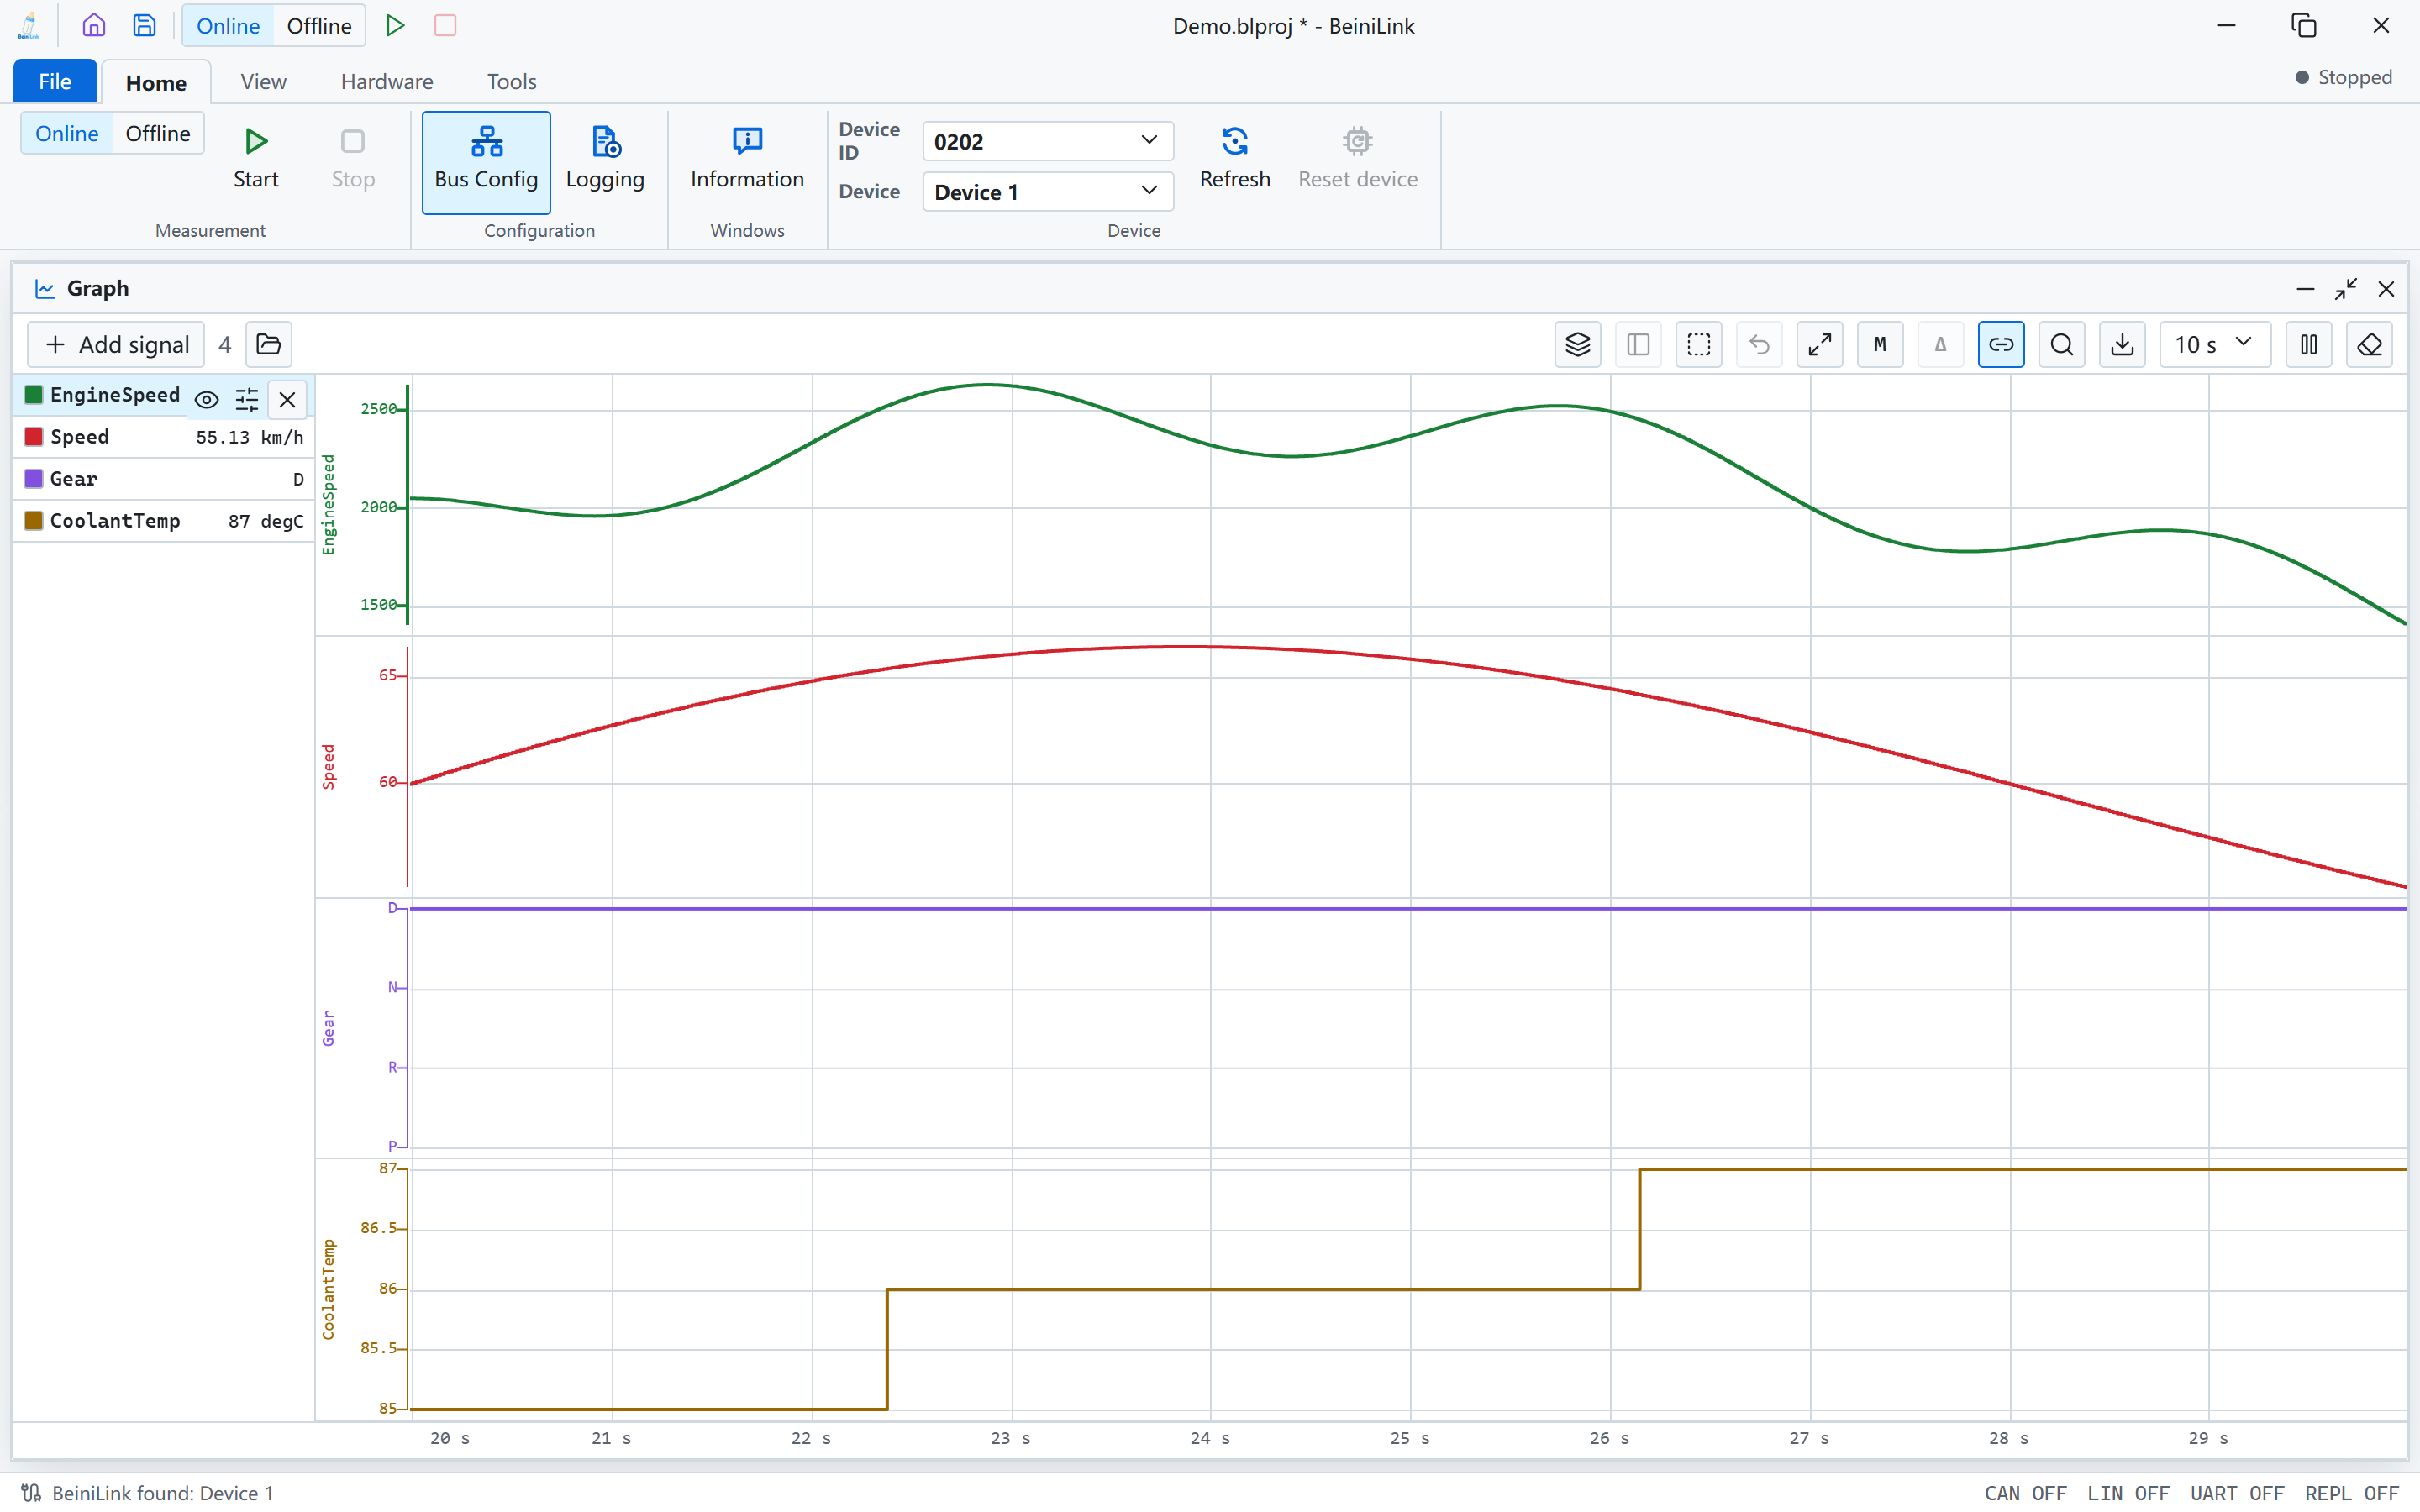
- Shows signals in separate lanes, with state names for enum signals
- Lists current values on the left
- Offers measurement cursors, zoom and CSV export, and can view recorded logs
Statistics
Shows bus health and the cycle time of each ID.
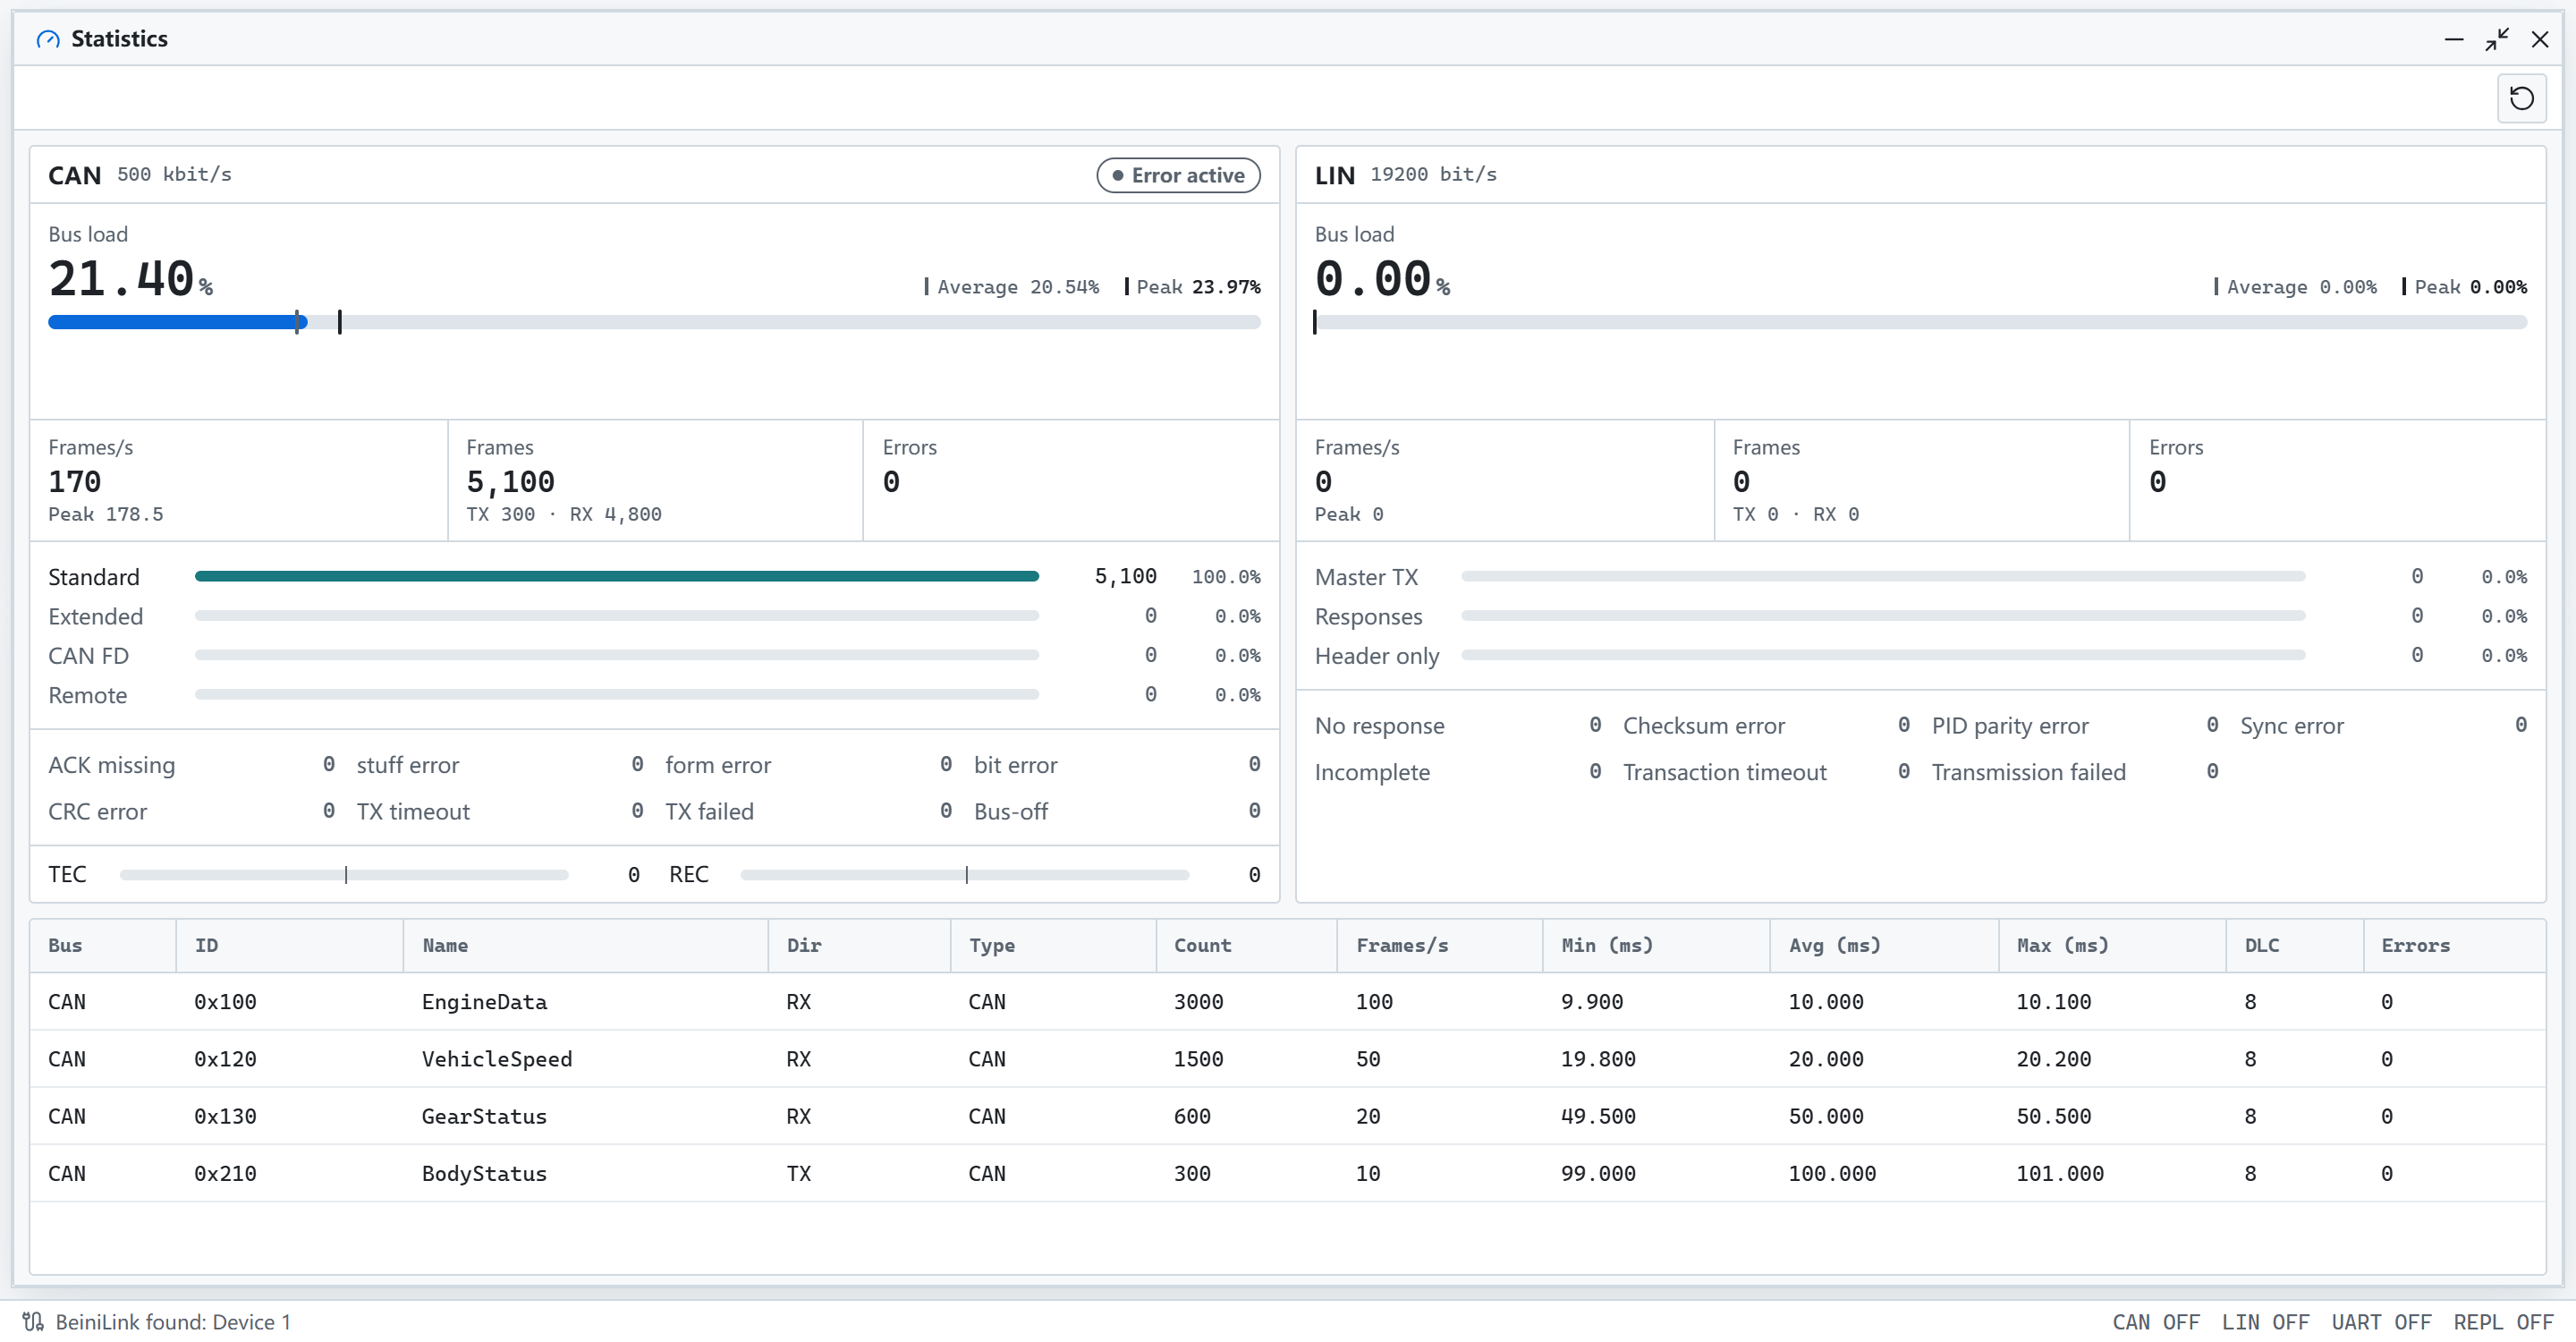
- Shows bus load, frame rate, frame types and error classes
- Shows CAN error counters and controller state
- Lists count, rate and minimum, average and maximum cycle per ID
CAN Sender
Sends CAN and CAN FD frames manually or periodically.

- Each row is one frame, with ID, frame type, length, trigger, period and data
- Adds messages from a DBC and edits them by signal
- Imports and saves send tables
See CAN.
LIN Schedule
Sends headers and data as master.
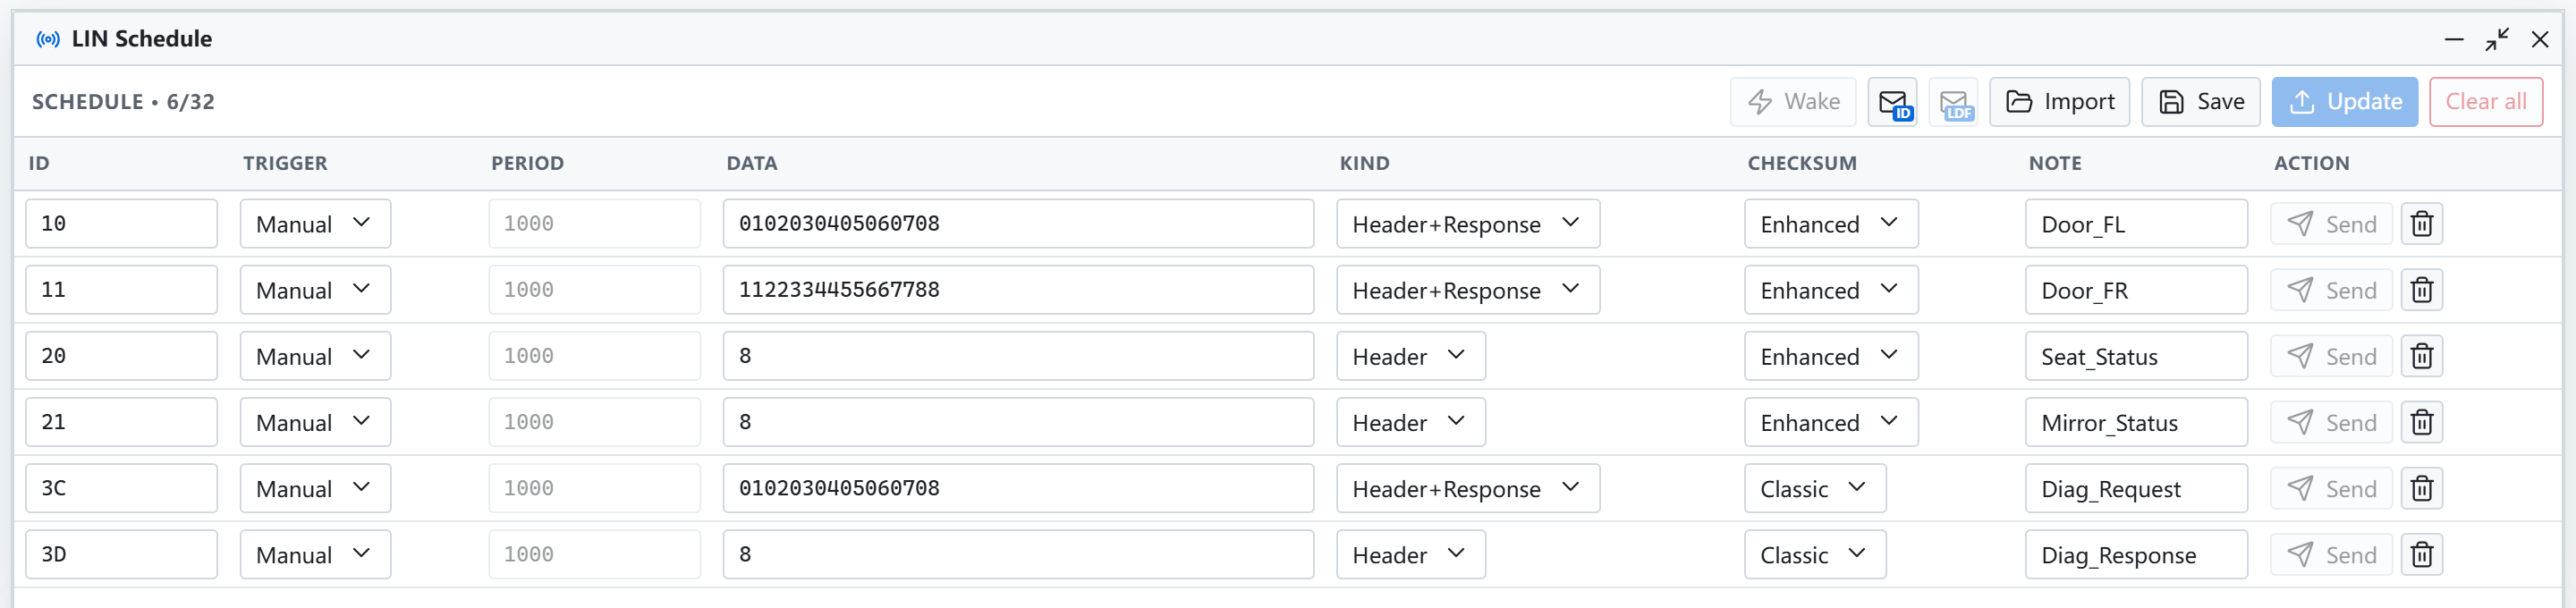
- Each row sets ID, trigger, period, data, type and checksum
- Uses a custom schedule or a schedule table from an LDF
- Supports manual send, periodic schedules and wakeup
See LIN.
MeLiBu Scheduler
Runs MeLiBu frames from a plan.

- Uses a custom table or MBDF as the source. Custom rows edit the frame, recipient, delay and signal content with an encoding preview; MBDF uses a schedule table or an imported
.mbdfscrscript - Sets the run mode and error policy
- Lists order, planned time and source location, with progress and timing deviation during a run
UART Sender
Sends text or hex data over serial.

- Each row is one item, sent manually or periodically
See UART.
UART Trace
Shows data sent and received over serial.
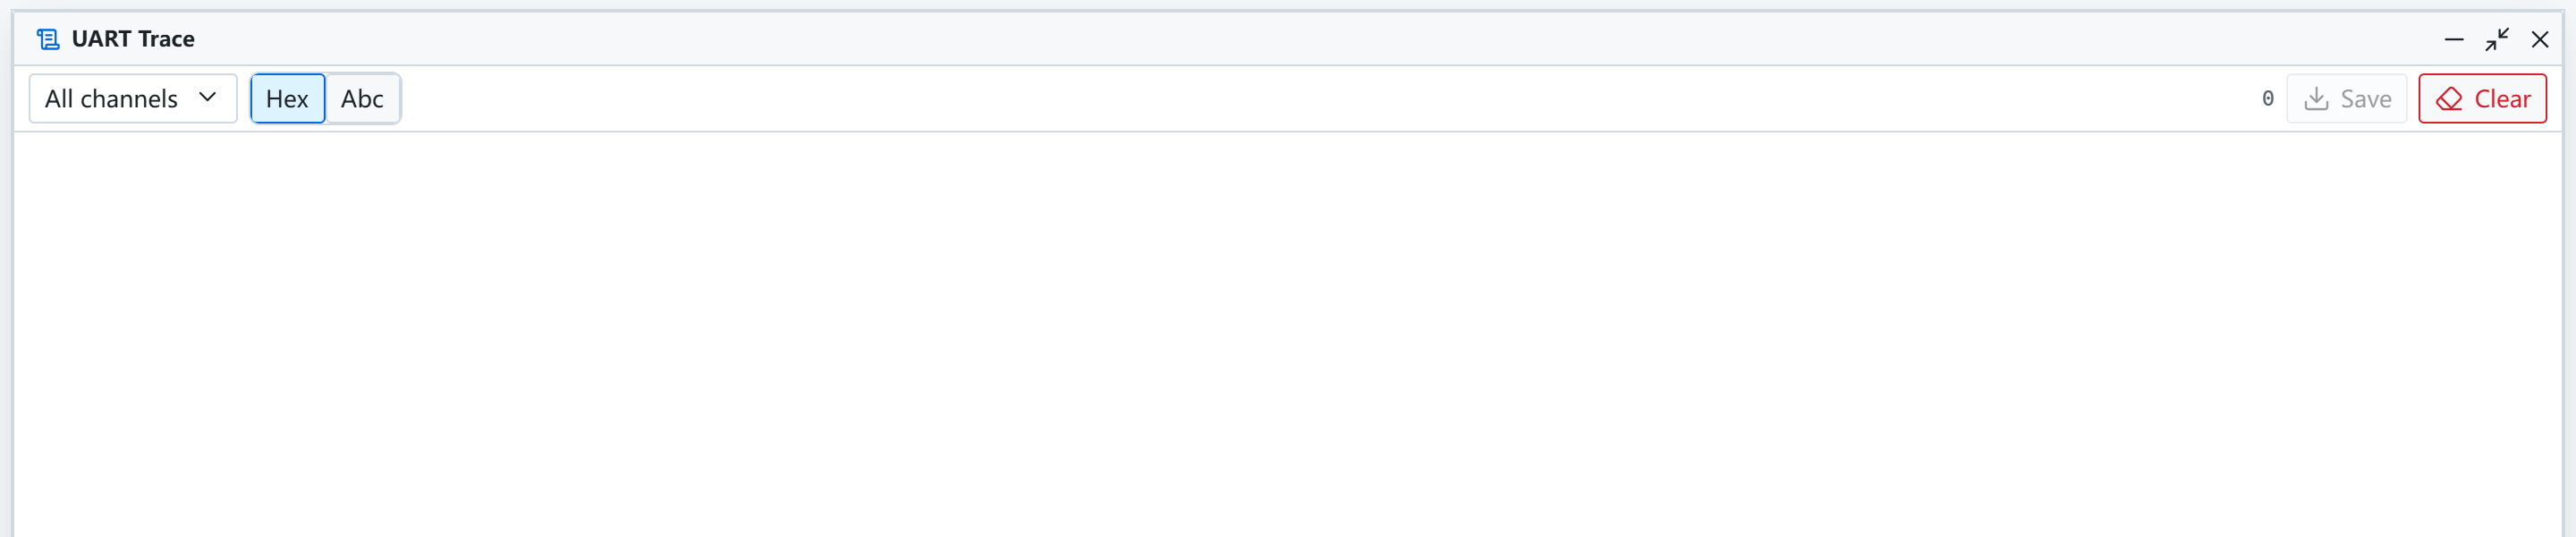
- Switches between hex and text
- Filters by channel, with export and clear
Variables
Manages project and system variables.
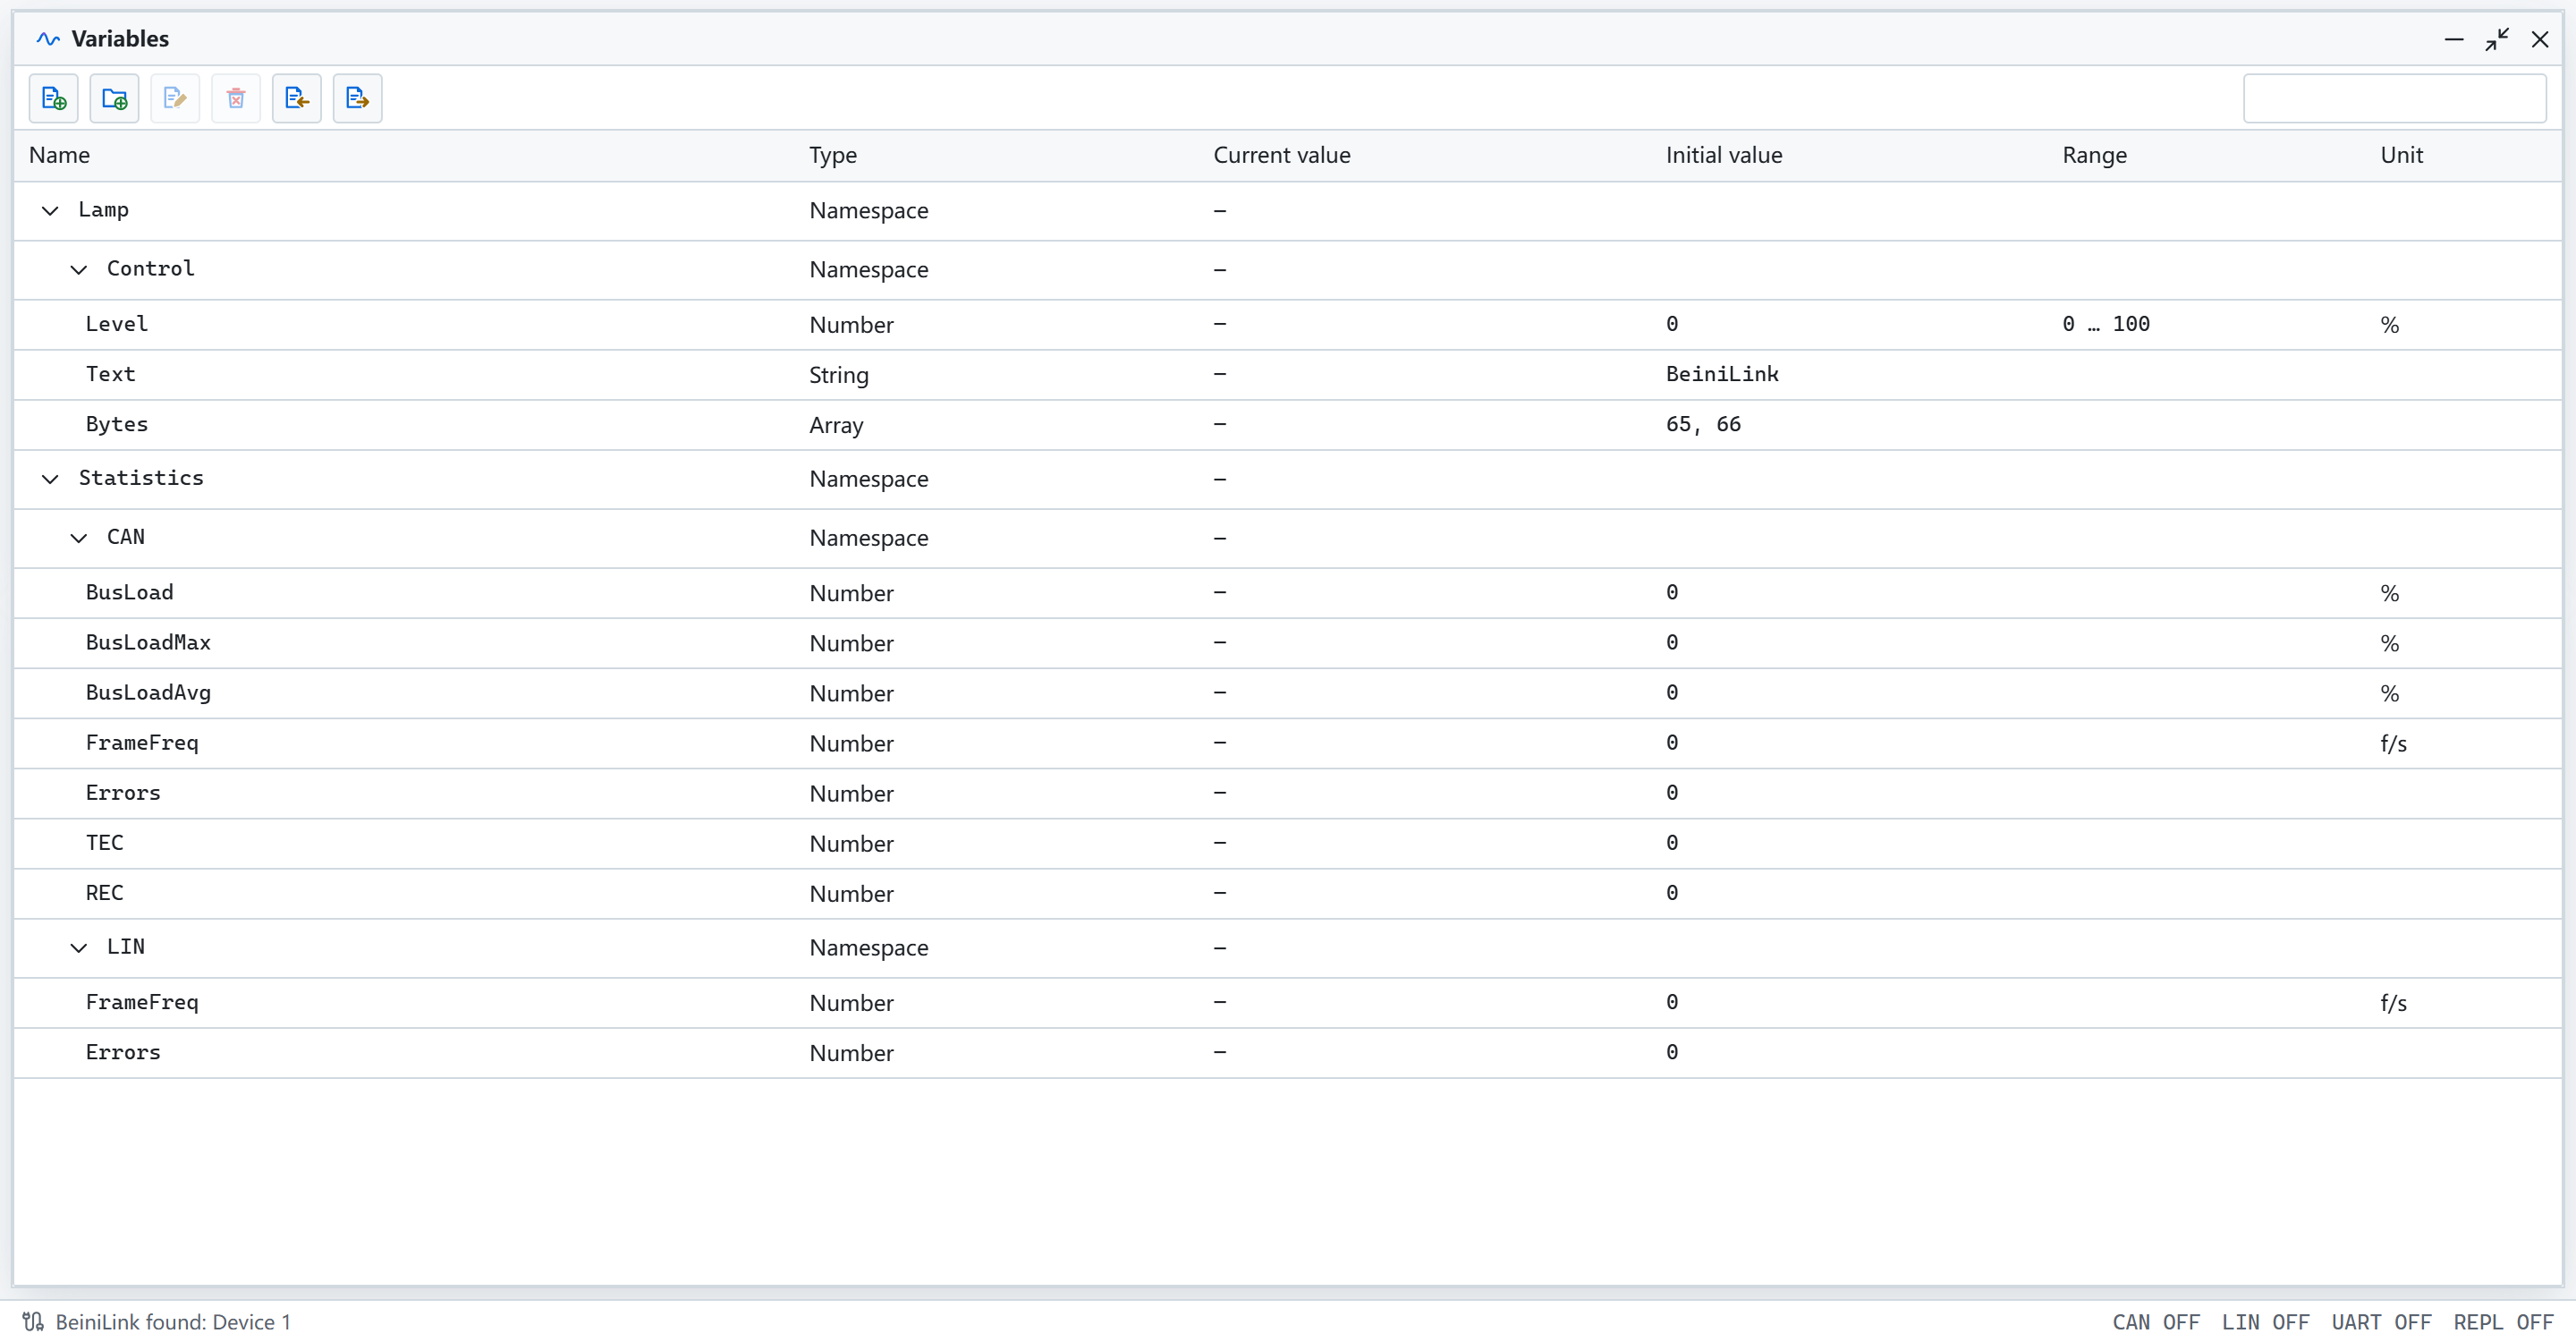
- Shows type, current value, initial value and unit by namespace
- Imports and exports CANoe
.vsysvarfiles
See Variables.
Panels
Builds your own test interface from controls bound to signals and variables.
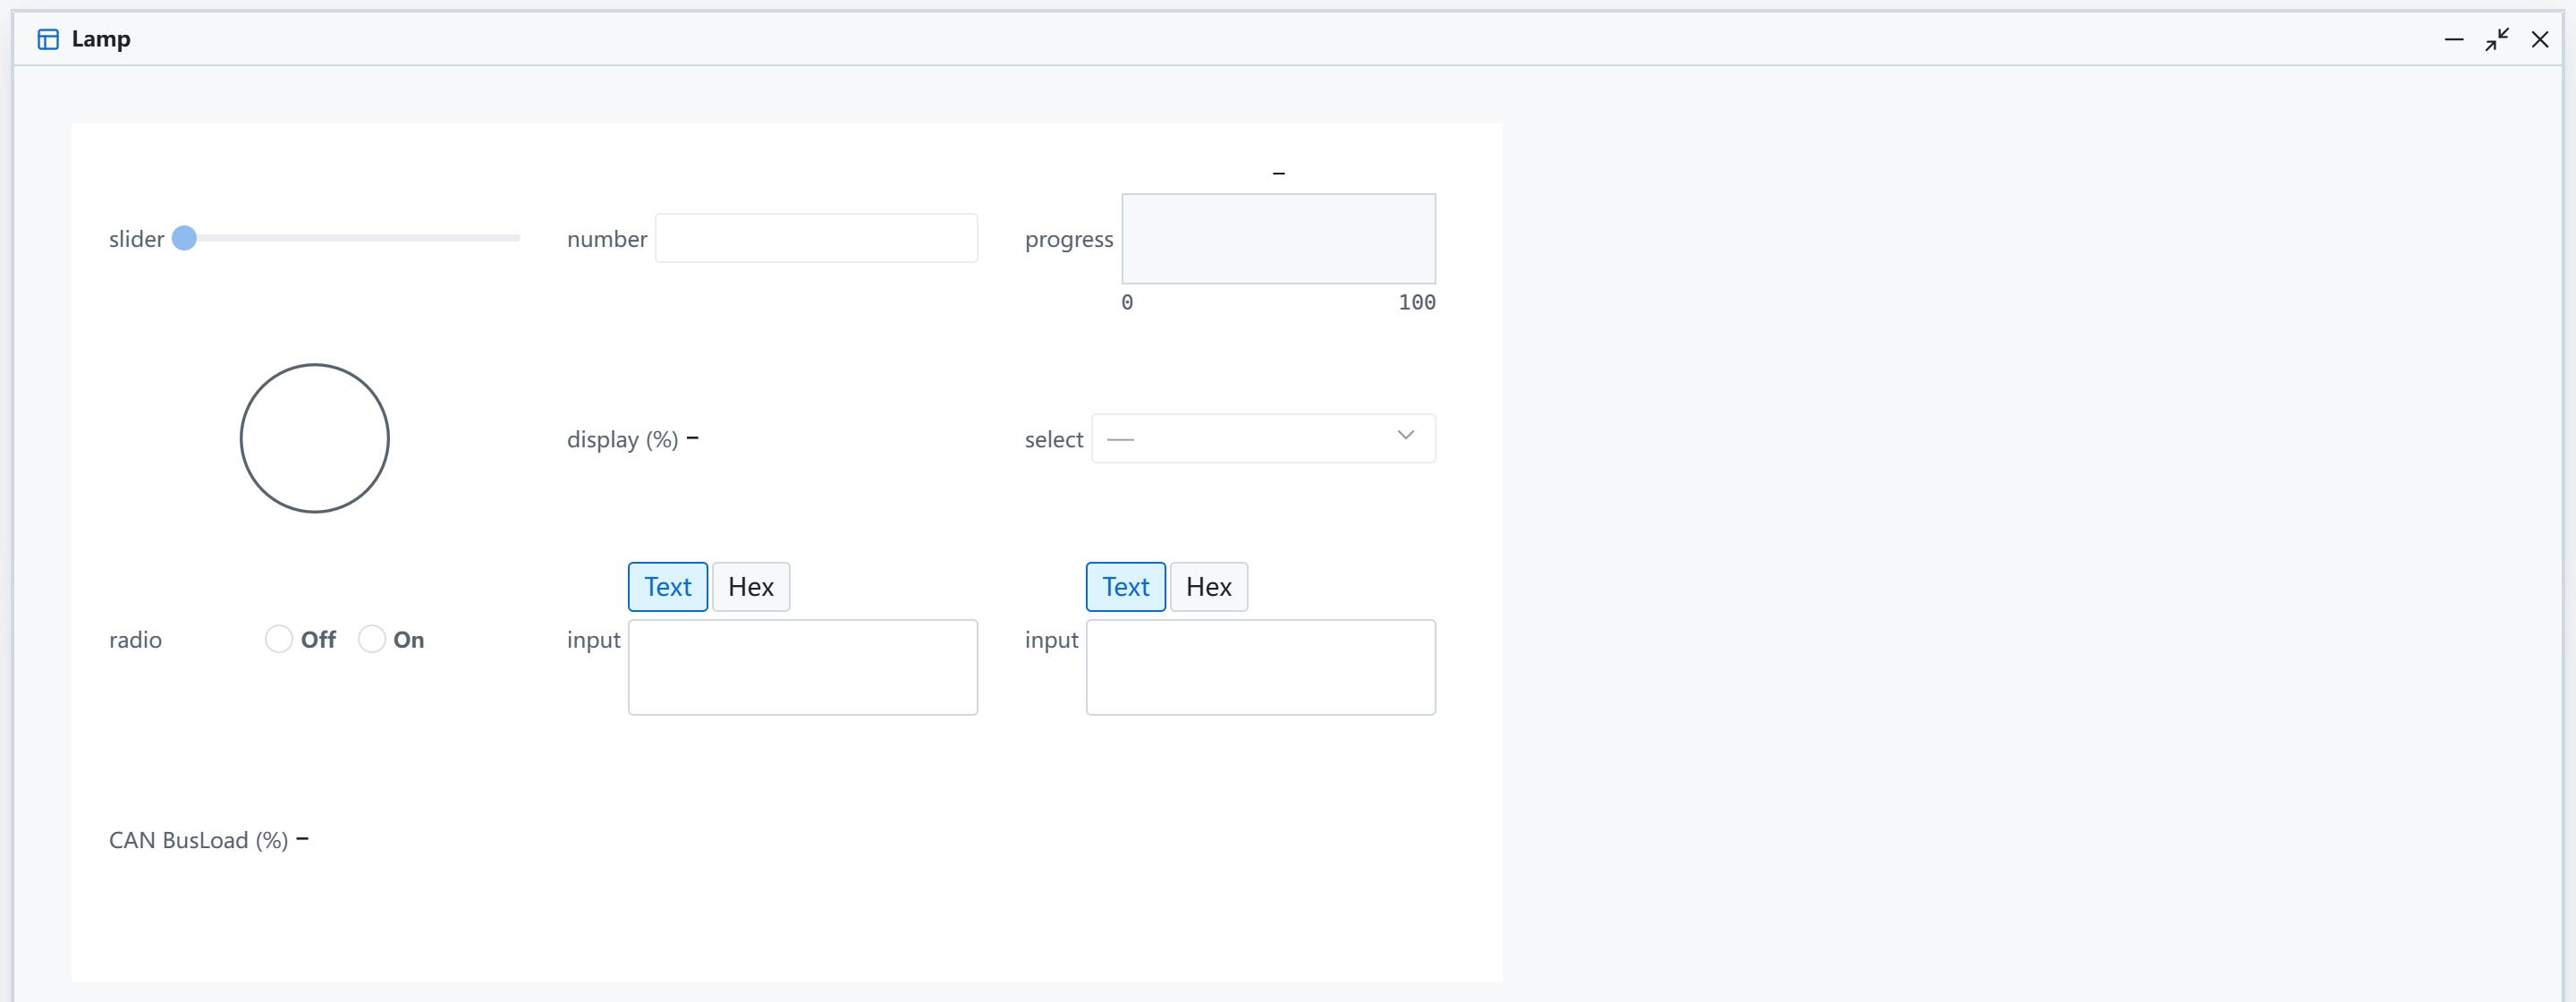
- Offers sliders, number inputs, lamps, progress bars, selectors and more
- Bound controls read and write live during measurement
- Opens the designer from the panel manager, and imports CANoe
.xvpfiles
See Panels.
Python
Writes and runs simple Python scripts on the device.
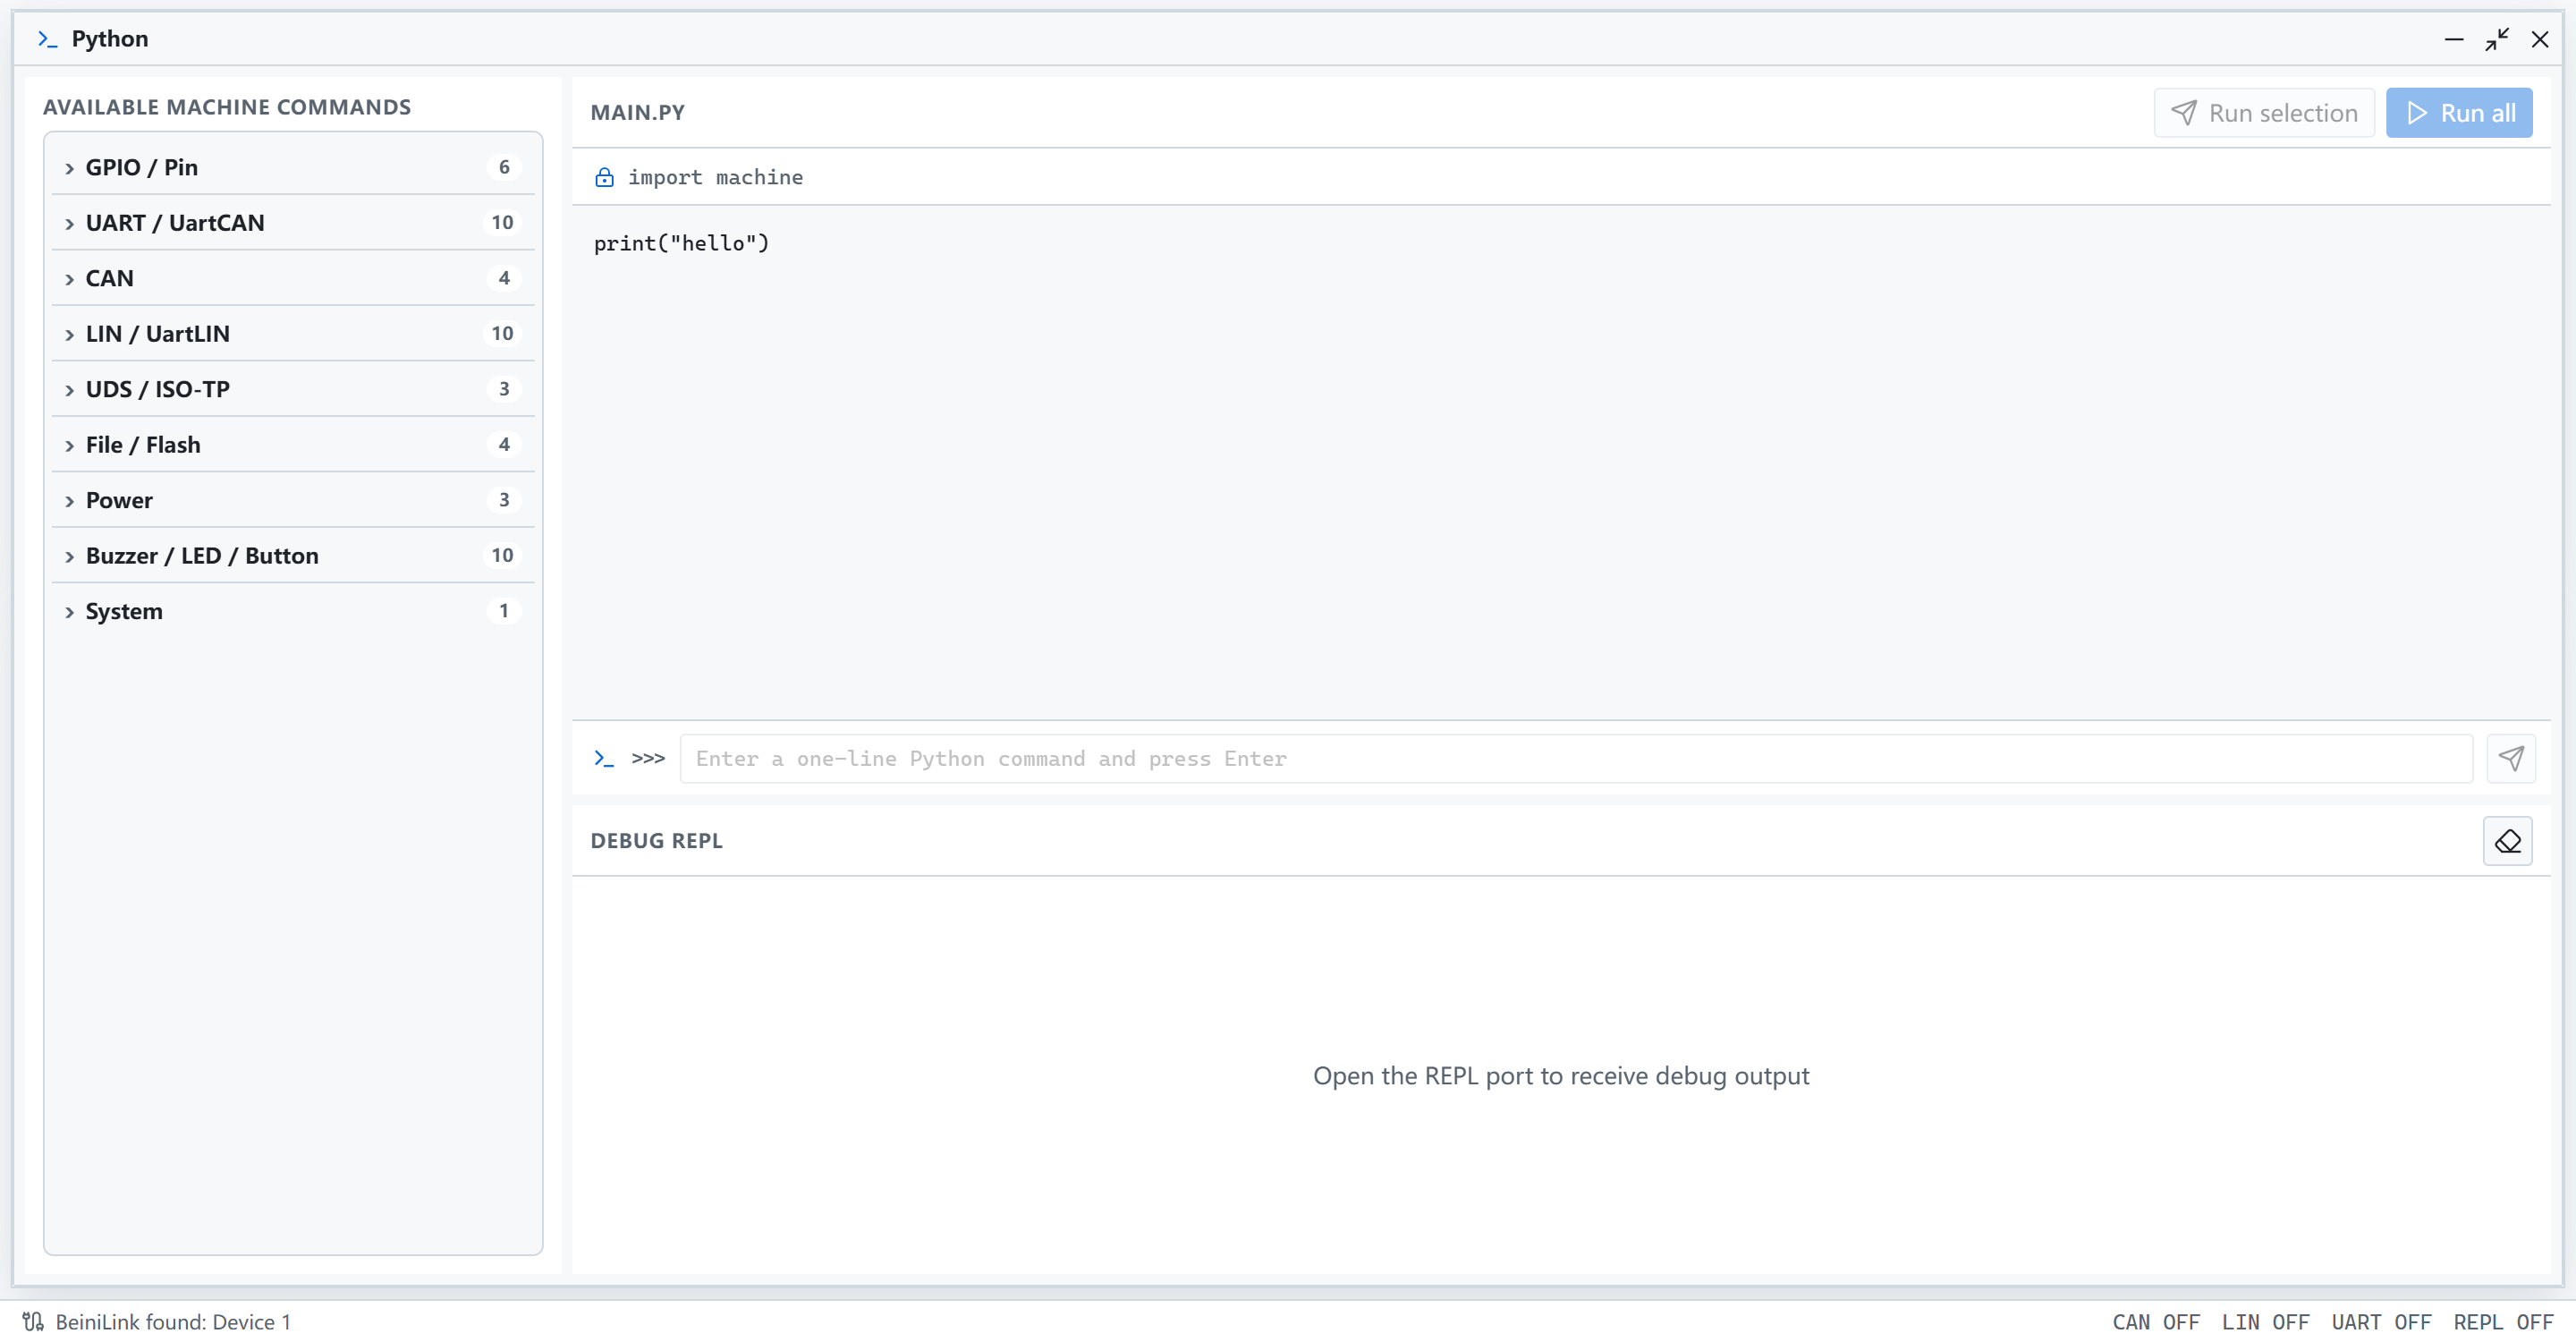
- Lists available commands on the left
- Edits scripts in the center, with a REPL terminal below
See Python.
Information
Shows status and messages from the application.
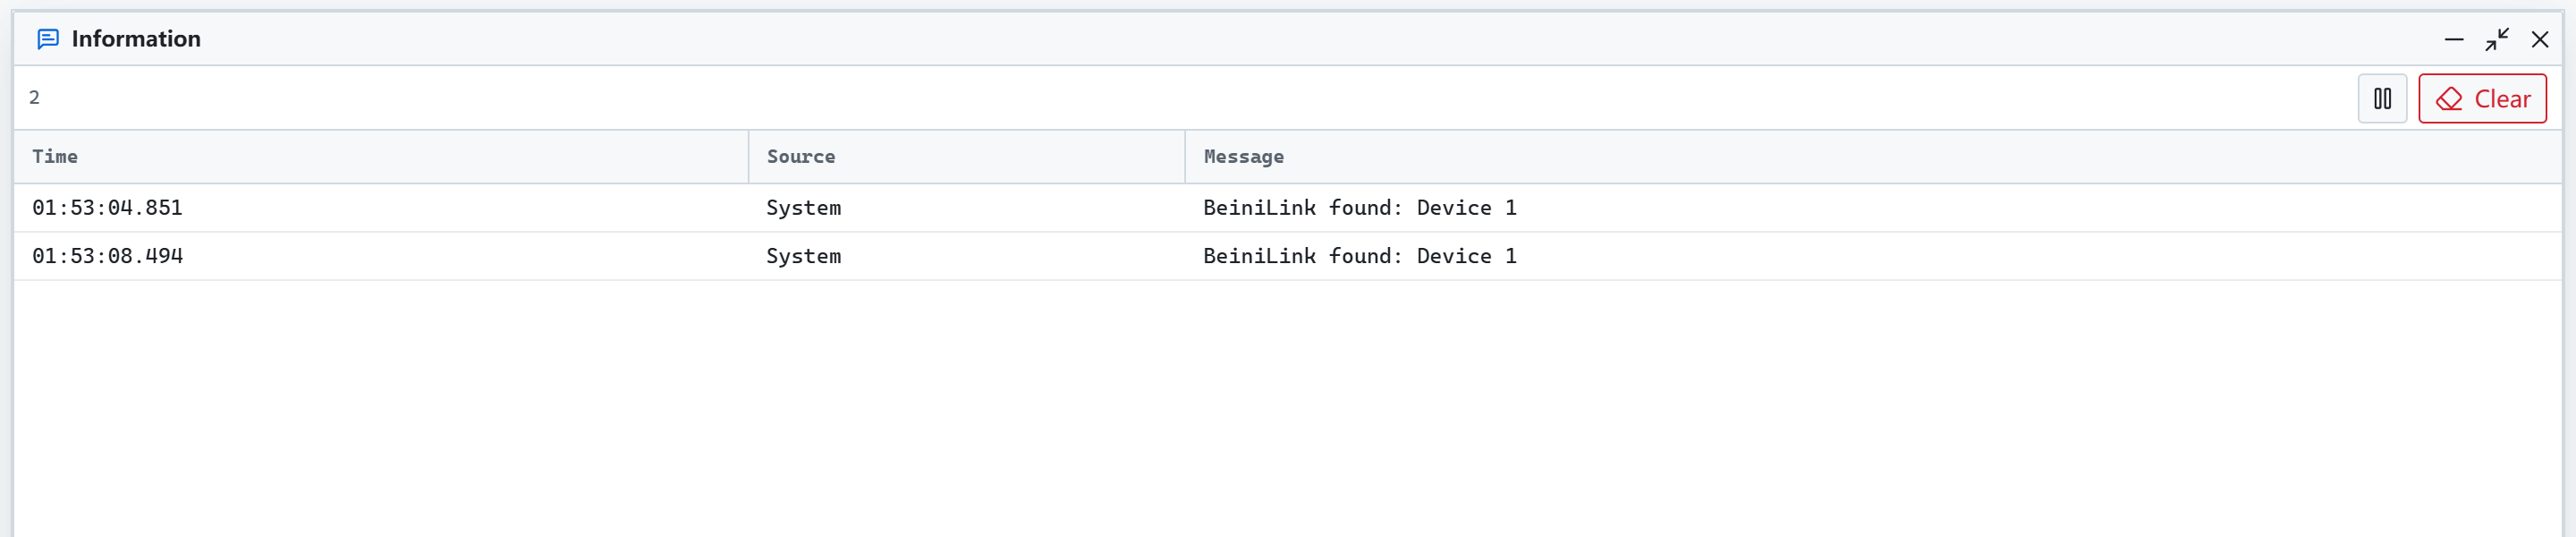
- Records interface opens, device connections and similar events
Logging
Configures how bus and serial logs are recorded. Open it from the Home tab.
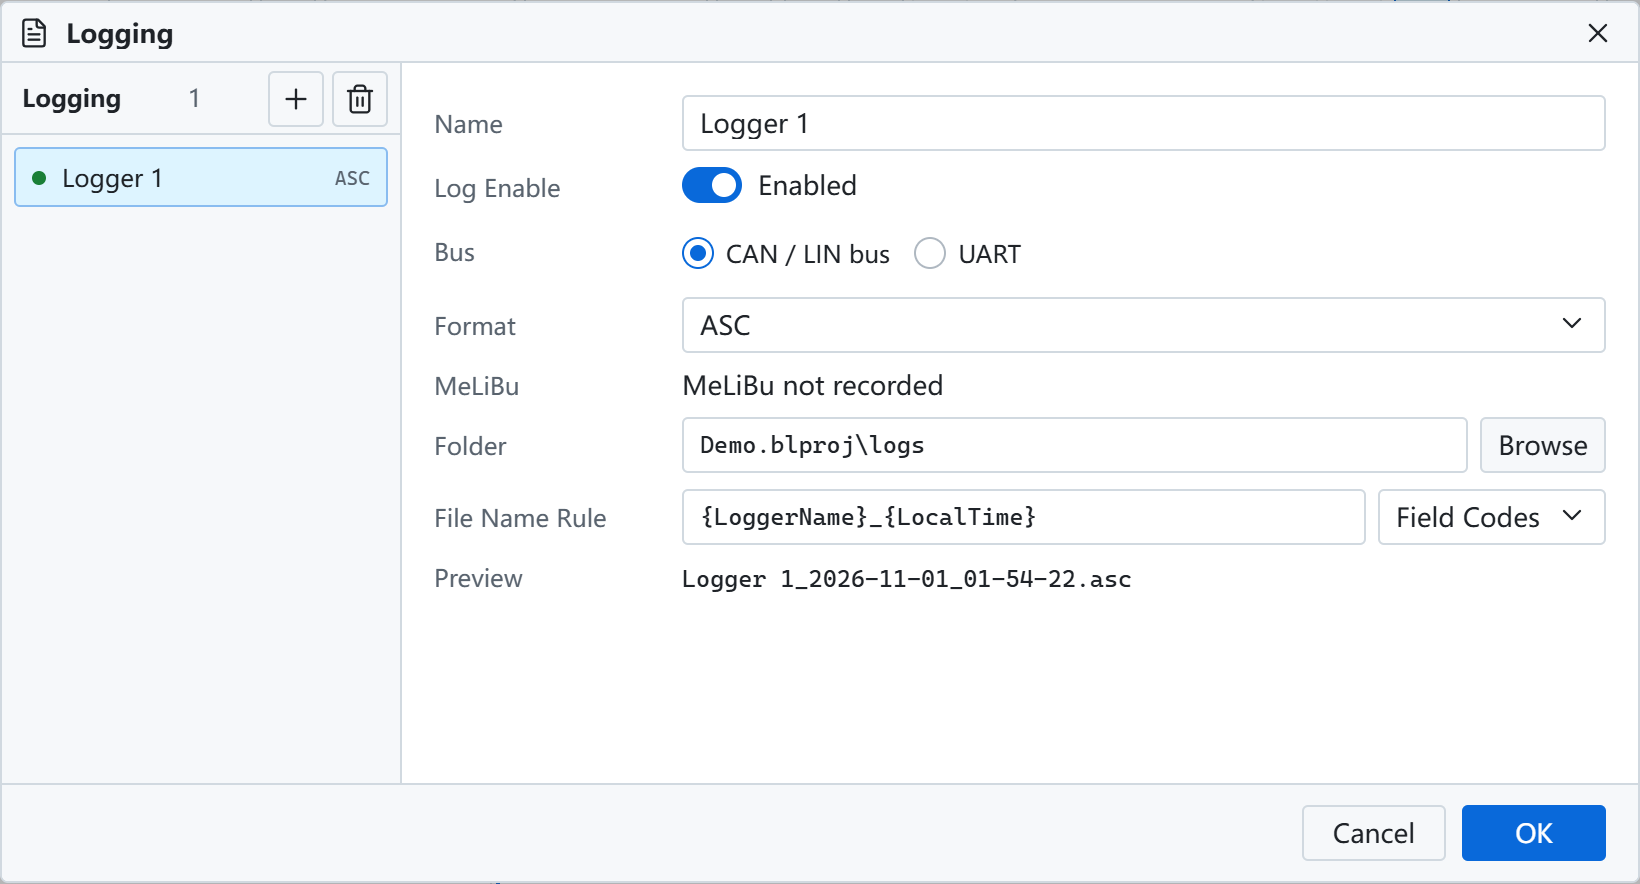
- Adds several loggers, each with its own buses and format
- Sets the output folder and file name rule, with a file name preview
See Logging.
Replay
Sends a recorded log onto the bus, or loads it into Trace and graphs offline.
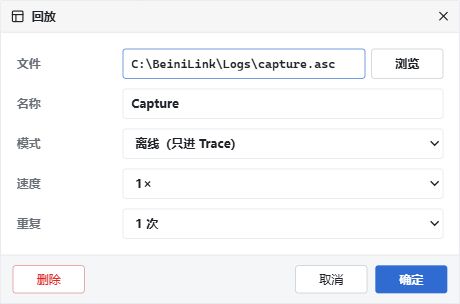
- Selects a BLF or ASC file and the replay range
See Replay.
Code Generation
Generates C interfaces from a database. Open it from the Tools tab.
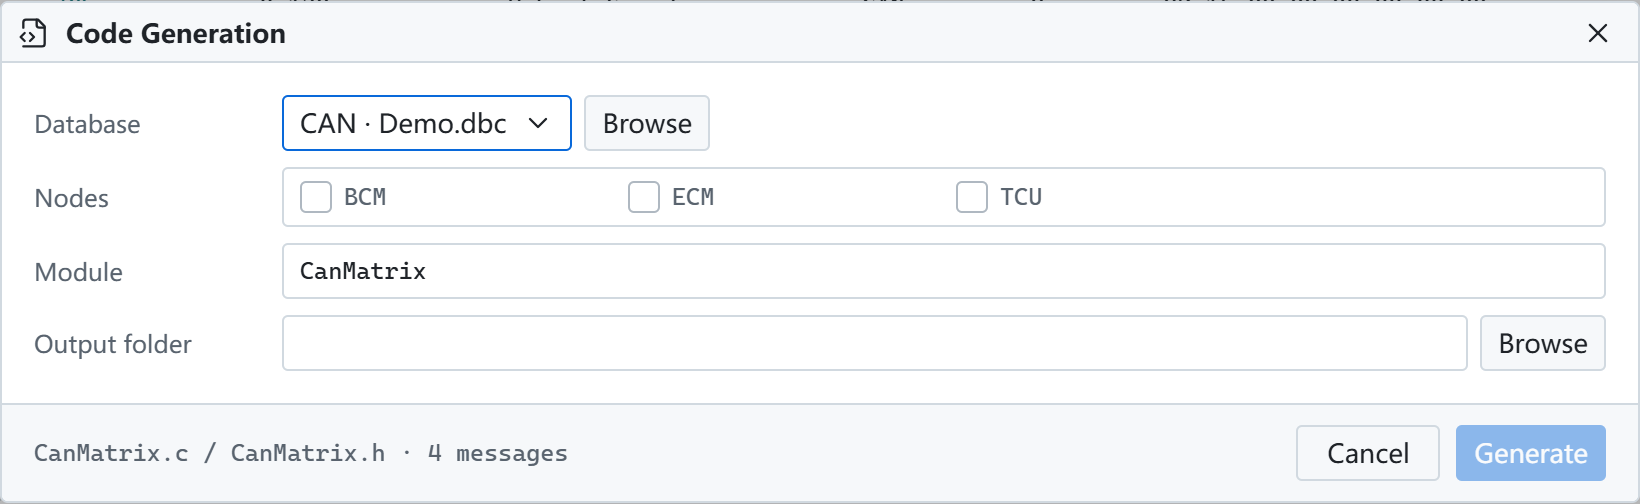
- Selects the database and nodes, and sets the module name and output folder
Log Conversion
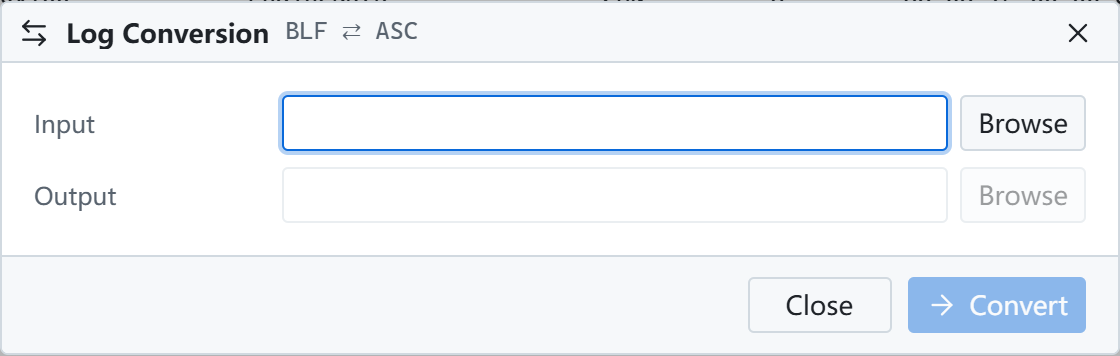
Converts logs between BLF and ASC. Open it from the Tools tab.
FirmwareConvert
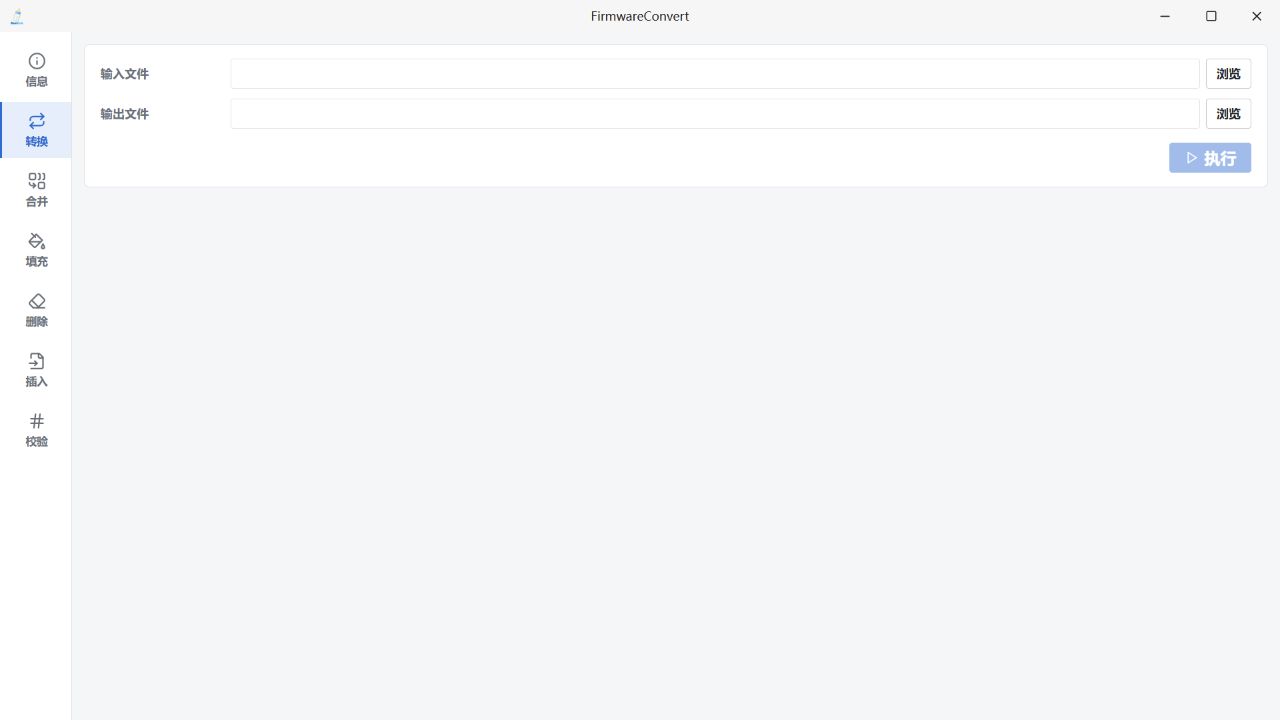
Converts HEX, BIN and S19 files and calculates or inserts CRC32 and SHA256. Open it from the Tools tab.
See Tools.