
Trace, Timestamps and Signals
CAN, LIN and MeLiBu frames share one Trace; use the Bus filter to view one of them. The E2E column is hidden while only MeLiBu is shown. The Trace Logging button opens the bus Logger, or the Logger list when the project has MeLiBu enabled.
Columns and display modes
Trace shows time, bus, event, ID/name, frame type or LIN checksum mode, length, bytes, status, and interval (DIFF, in ms). Event view adds counts and interval statistics.
LIN Classic/Enhanced describes checksum, not the master/slave role. REQUEST confirms a successfully transmitted header and can have empty data. Control ACK/BEL and version replies are inspected in Information.
CAN bus errors and failed transmissions appear as red CAN Error rows in Trace. Data shows the reason; Status shows TEC/REC, plus paused transmission for TX timeouts and Bus-off. Errors remain separate from normal data with the same ID. Event view updates their time, interval and count; the Errors direction filter isolates them. Details include MCU time and raw registers. Firmware coalesces snapshots while USB is busy, so counts represent reported events, not every hardware retry.
LIN transaction timeouts, failed transmissions and invalid monitor captures appear as red LIN Error rows, including sync, PID parity, checksum and no-response conditions. Empty data and unknown IDs remain visible. Successful REQUEST headers stay separate. Details preserve captured bytes without decoding invalid payloads into application signals. LIN errors do not stop measurement and are not written to Information. Updated firmware includes the ID and MCU detection time for master errors; bare !3 records only have host arrival time. Scheduled repeated failures retain the first-report policy, so counts are not complete physical error totals.
Scroll view keeps recent individual records and follows new frames. Mouse scrolling pauses display updates; Resume restores live display while acquisition/logging continue.
Event view merges CAN frames by standard/extended attribute and ID, and LIN frames by ID. A new frame updates that row, including direction and data. TX/RX share the same key. Use scroll view for complete ordering.
Scroll DIFF compares adjacent filtered frames. Event DIFF compares consecutive frames of the same key. The live display cache is capped at 5000; use Logger for full long captures.
The folder button in Trace opens an ASC/BLF history log. The app builds a time index and reads 1000 frames per page. Use Previous/Next or enter seconds relative to the log's first frame to locate the nearest frame. History pages are separate from the live cache; close the history page to return to live Trace. Measurement and logging can continue while browsing; reopen a growing log to refresh its index. History shows parseable CAN/LIN data frames; ASC comments and BLF markers are not frame rows.
If a BLF file ends in a partial object, Trace, graphs, and replay retain the complete frames read before it and report an incomplete file tail in Information. Invalid headers, oversized objects, and decompression errors still fail the read.
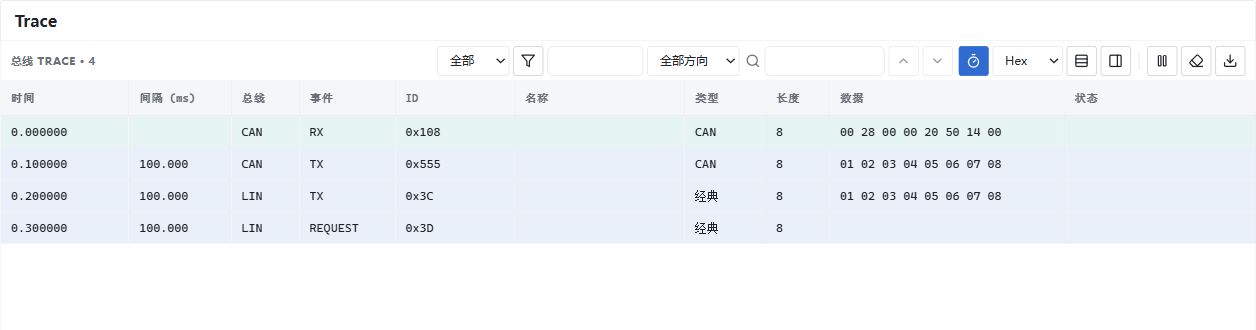
Illustrative Trace data. LIN REQUEST indicates a transmitted header with an empty data field. The shown intervals are not hardware measurements. Chinese UI.
Raw frame details display only the bus name and hexadecimal payload, such as CAN 02 10 03 00 00 00 00 00, without ID/DLC labels or SLCAN/SLLIN transport records. Empty payloads show “—”. LIN errors retain the received capture separately under Captured bytes.
Drag a header column separator to resize that column; double-click restores its default width. Long content is truncated within its own cell and available on hover, without covering adjacent columns. Scroll horizontally when the total column width exceeds the viewport.
Drag the separator to the left of Details to resize the sidebar; double-click restores 300 px. The sidebar width is remembered and temporarily limited in narrow windows. Focus the separator and use left/right arrow keys for keyboard resizing.
Time sources
Relative time is seconds from the first frame of that clock source in the measurement, displayed to six decimals. MCU metadata is used when available for CAN RX, CAN/LIN TX completion, or LIN capture. Otherwise host arrival time is used. Absolute display uses the frame timestamp; in a standalone offline session this is relative log time, not calendar time.
MCU and host sources have separate origins; cross-source DIFF is not computed. Decimal places alone do not establish precision. Standalone offline sessions use relative log time regardless of speed. Concurrent replays each start at zero and are displayed in arrival order, which can make time non-monotonic. An offline replay started manually during an online session uses host arrival time in Trace and the Logger.
Signal conditions
The signal filter and trigger icons each configure one condition: database message, signal, physical or raw value, comparison and threshold. Operators are ==, !=, >, >=, <, <=; raw values accept decimal or hexadecimal integers.
Filtering affects display only. Triggers check every incoming frame before aggregation and freeze Trace at the first match. Choose Pause display to continue acquisition/logging, or Stop measurement. Resume does not rearm; use Rearm or start a new measurement. Each arm fires once. Conditions are saved in the project.
Triggers run on the host after USB delivery, with transport and processing latency. They are not MCU hardware triggers.
Controls
Filters opens the filter pane on the left: choose the bus and direction (TX, RX or errors) and optionally show only E2E errors. Stop filter hides the listed IDs and Pass filter shows only the listed IDs; type hexadecimal IDs separated by spaces/commas, such as 555, 108, and press Enter. Each group has a checkbox to turn it on or off. Right-click a row, or drag rows onto either list, to add the row ID or the IDs of all selected rows; dragging opens the filter pane. While the pane is closed, the Filters button turns blue when any filter applies. Search displayed text and navigate matches. Data formats include Hex, Bin, Dec, and ASCII.
Details decode selected frames using DBC/LDF. Export saves displayed CSV rows, not an ASC/BLF capture. Clear removes cached frames; starting again also starts a new time origin.
Load a database and add signals in View → Signal Graph to observe physical values. Information contains host-timed runtime logs, not precise hardware timestamps.
In Lanes, each visible signal has its own plot and colored Y axis, with the signal name rotated vertically. All lanes share an axis width based on the longest tick label, capped at 35% of the chart area; longer labels end with an ellipsis. When space permits, discrete signals show database state names, while values outside the state table remain numeric. Each lane is at least 64px high. The chart scrolls vertically when needed, with the legend and time axis staying in place.
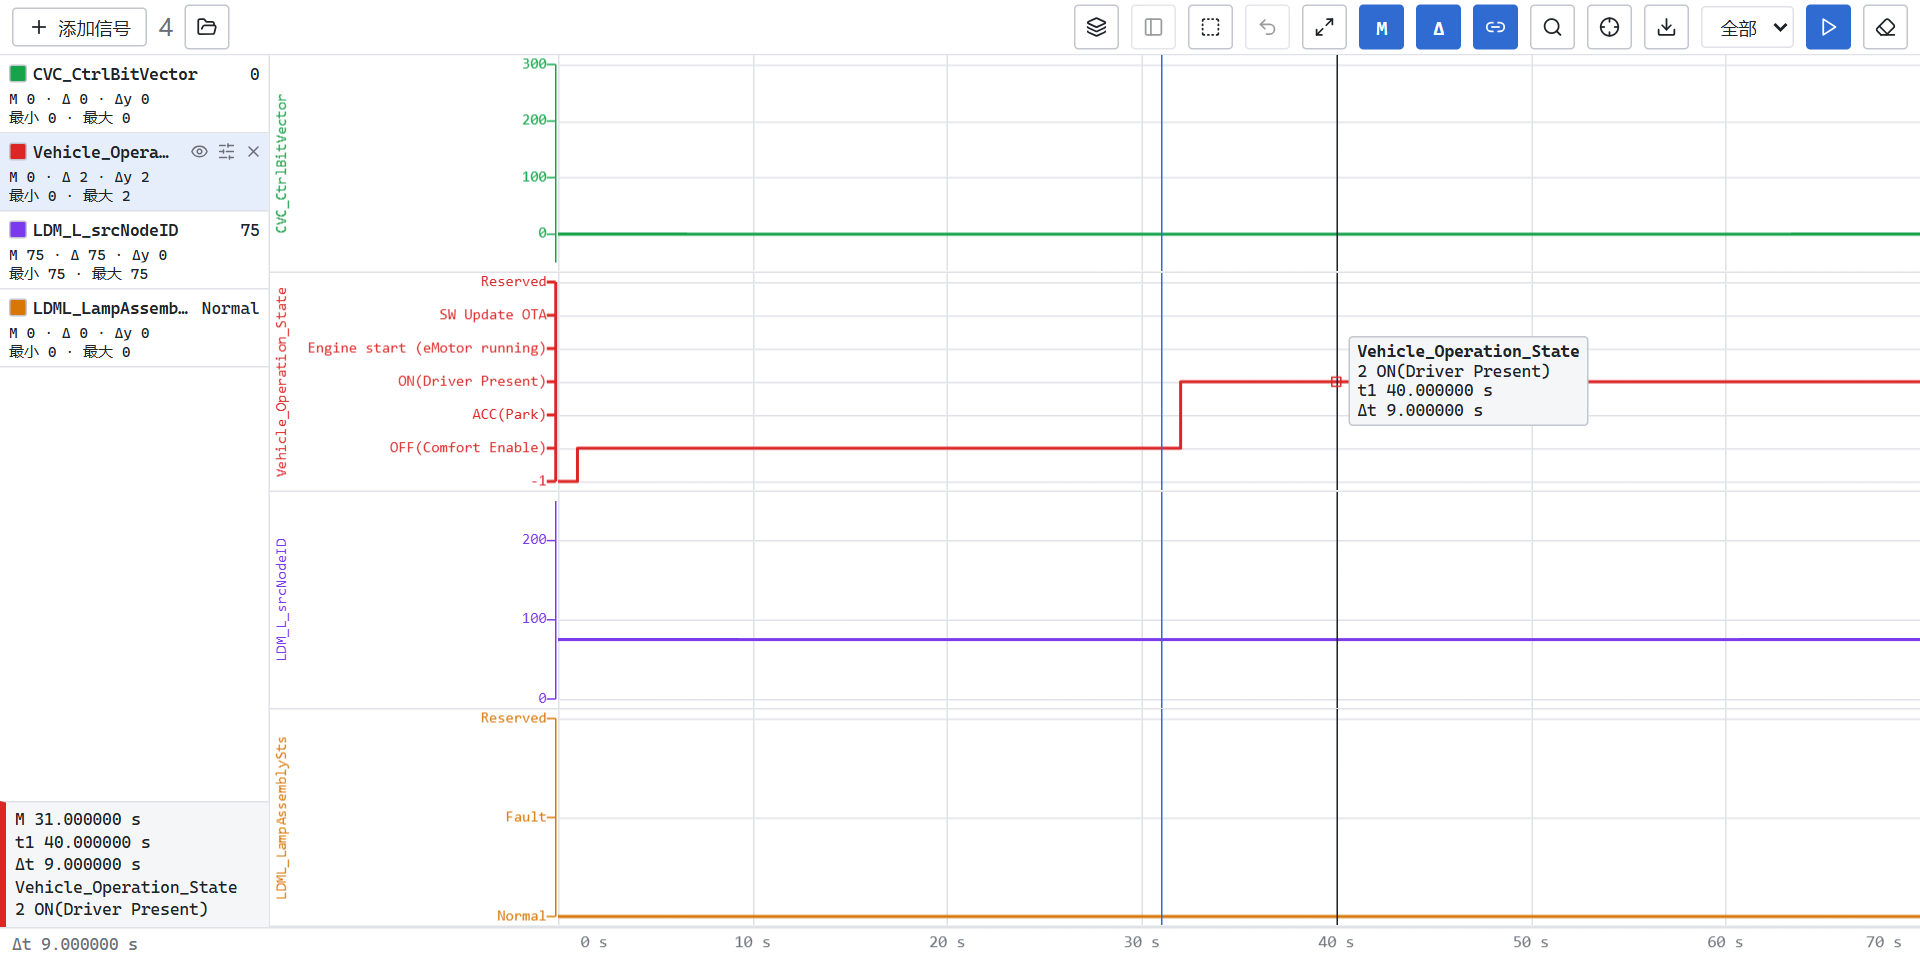
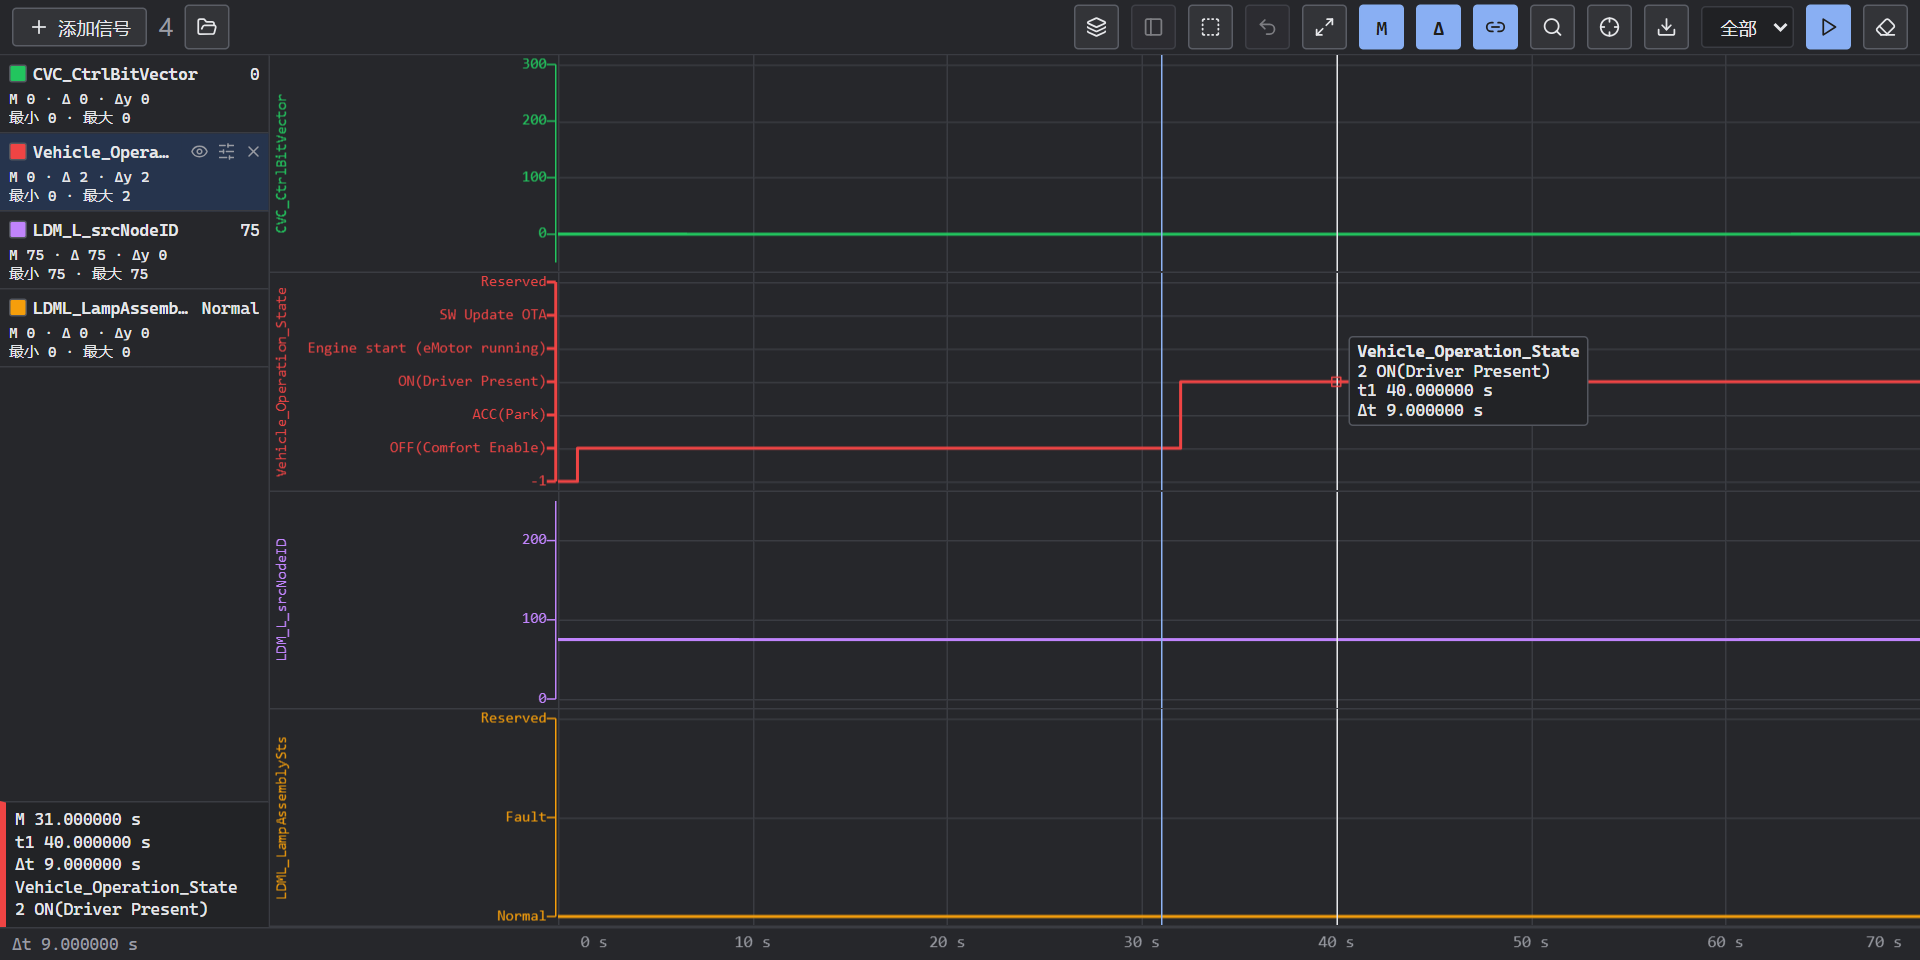
Opening an ASC/BLF log first shows a min/max-preserving preview of dense data. Zoom in to reload exact samples for the current view through the log index. Hover over a legend row to see its message and displayed sample coverage. Exact readouts and nearest-frame snapping require original samples. M/Δ interval minimum and maximum values are read separately and remain accurate for compressed intervals.
Use Overlay to compare signals in one plot, each with its own Y axis. Click a legend row to select a signal. The axis button switches between the selected axis and all axes; +N reports axes omitted for lack of width. Use Lanes to return to separate plots. Switching layout retains the current view and selection.
Click M to reset both cursors, then click or drag in a plot to set the blue Measure reference. Once M is set, click Δ, then click or drag to place the black Difference line (light in the dark theme). When original samples are available, dragging either cursor snaps to the nearest recorded sample of the selected signal; ties choose the earlier frame. A colored hollow square marks that sample. With time linking enabled, M follows Trace; moving Δ keeps M and Trace in place. Both cursors also work locally with time linking disabled.
The time lines span every visible lane, including signals without samples. A horizontal resize pointer appears near a cursor line and while placing or dragging it. Both cursors can be dragged independently at any time from any lane without selecting their buttons again; M also remains draggable while placing Δ. If the selected signal has no samples in the current view, snapping uses another visible signal with the same clock, while the empty signal still displays -. Preview, loading, and empty views still allow moving the time lines. Dragging resumes snapping when original samples become available and never zooms the view. When the lines overlap, separate Δ first, then adjust M.
When both cursors are shown, M resets both and starts a new reference; Δ hides both. Clicking Δ again restores them in the current time view and snaps to visible samples without returning to the old view. An empty view still shows the cursors, with - for the value. The bottom-left readout and plot tooltip show the selected signal, value, time t1, and Δt = Difference − Measure; an earlier Δ produces a negative interval.
Each button indicates its cursor's enabled state: M alone highlights M, both cursors highlight both buttons, and hiding or clearing them turns both off. A cursor's button also highlights while placing it.
Lanes and Overlay share the cursor positions. Clear cursors, Resume, or changing projects/logs clears them; a new live measurement resets the live cursors. Cursor positions and temporary ranges are not saved in the project. During live following, axis width changes in 8px steps and only grows. Fit all, changing signals, or opening a log recalculates it; shrinking the window still enforces the width limit.
The compact legend shows each signal's name, current value, and unit. When both cursors are shown, the rows below show their physical values, Δy, and interval minimum and maximum. Hover over the summary for full state names. Click a color square to change the color. Hide/show, settings, and remove buttons appear when a row is hovered, selected, or focused; right-click also opens settings. Hiding a signal removes its lane and redistributes the remaining lanes. Hidden signals still receive data and remain included in searches and CSV. Signal settings select Step, Line, or Points. To set a manual range, enter its minimum and maximum and confirm; the minimum must be smaller than the maximum. Invalid inputs have a red border and cannot be saved. Layout, color, visibility, draw mode, and manual ranges are saved with the project.
Wheel over a plot to zoom time and drag to pan. Wheel over a Y axis to zoom its range, drag vertically to pan it, and double-click to clear its temporary range. Ctrl-drag in the plot, or enable Box zoom and drag, to zoom time and all visible Y ranges together. A box narrower or shorter than 6px zooms only the other direction; Esc cancels. Zoom back restores up to 20 previous views and groups consecutive wheel operations into one step. Fit all restores the full time span and clears temporary ranges and history. These navigation operations do not modify the project; manual ranges remain saved and temporary ranges are discarded when the project closes.
Use Search to find a physical value that equals, exceeds, or falls below a target; crosses a threshold up or down; or is the minimum or maximum. Log searches scan the original records and link the result to Trace. Live searches cover only retained graph samples.
Trace and graph time synchronization
The link buttons in both windows are enabled by default. In scroll view, click a Trace frame or move with Up/Down to position the graph's blue measurement cursor. Clicking a plot or dragging the blue cursor first snaps to the nearest signal sample, then selects the nearest Trace frame from the same clock source; equal distances choose the earlier frame.
Positioning pauses display following while acquisition and logging continue. The graph preserves its time span and pans when needed. Ordinary dragging pans the view; dragging M/Δ moves a cursor. Resume clears the shared cursor and restores live following in that window.
No replacement row is selected when the target frame is filtered out. If a plotted sample falls outside the 5000-frame live Trace cache but has been written to ASC/BLF, Trace opens that log and locates the frame while the graph remains live. Selecting a historical Trace row moves the live graph cursor back to the corresponding sample. Unlogged ranges are not located automatically; close historical Trace to return to the live cache. Aggregated event view and mixed-clock signals do not participate in live linking. Each window can disable its link button. Clearing Trace, changing projects or starting a measurement resets the live shared cursor.
Opening an ASC/BLF file in either window shows the same file in the other. Selecting a historical Trace frame or seeking by time positions the graph cursor at the corresponding file-relative time. Clicking or dragging the graph cursor locates the nearest data frame in historical Trace. File time stays separate from the live device clocks. Returning to live view in either window closes the historical file in both.
Markers, reference events, and interval values
Select a frame in scrolling Trace, then use Add marker to enter a name, color, and comment. The marker appears on the Trace row and signal plots using the same clock. Click a marker to return to its time; the Trace marker bar supports previous/next navigation, editing, and deletion. Markers in an open log can also navigate across pages. Up to 100 markers are kept. Starting a new measurement, clearing Trace, or changing projects removes live markers; closing a log removes its markers. Markers are not written back to ASC/BLF.
Set reference event compares the current frame with the reference in the detail pane: time difference, changed bytes, and signal values for the same message. You can locate or clear the reference. It resets when the measurement or log changes. Frames from different clocks have no time difference.
M/Δ defines the graph measurement interval. When both cursors are shown, each signal has interval minimum and maximum values, and CSV includes samples between both endpoints. With only M or hidden cursors, CSV uses the visible time range. Historical interval statistics are read independently and preserve the view's exact samples. CSV fetches its export range when clicked; a range exceeding 20,000 samples in any signal cannot export a compressed preview. Shorten M/Δ or the visible range to export exact samples. Intervals without a sample or held value have no range statistics.
Bus statistics
Open View → Analysis → Statistics. CAN/LIN cards show load (last second, average, peak), frame rate, frame totals and errors. The ID table shows database names, direction, count, rate, DLC and minimum/average/maximum period in ms. Click a column to sort; drag its separator to resize. Narrow windows stack the cards and keep horizontal scrolling inside the table.
Statistics refresh every second independently of the Trace cache and display filters. Starting measurement clears them; stopping preserves the final values. Reset clears statistics while retaining the active channel settings. Offline mode shows replay counts and ID periods separately, without physical bus load; online replay counts device-reported traffic. Up to 4096 IDs are tracked; reaching the limit does not stop totals.
Periods use MCU time when available, otherwise host arrival time with ~. Clock changes are not treated as an interval. Classic CAN load includes CRC-15 and actual stuffing; CAN FD load is marked ~ because ESI and bit-switch sample timing are unavailable. LIN load uses nominal bits; a request header and its response count as one transaction. A captured unanswered header contributes 34 bits. Other failed/invalid frames do not contribute load.
CAN error totals marked ≥ count reported events, not every hardware retry. TEC/REC and controller state come from the last error snapshot; unavailable values show —. REC is the register's 7-bit count; the receive-passive flag also determines controller state. Controller state is not periodically polled.