
Logging and File Names
Configure a Logger
While stopped, open Home → Log or the Logger entry in Bus Configuration. Add a Logger, name it, enable it, and choose CAN / LIN bus, UART or MeLiBu as its source. The Logging button in Trace and UART Trace also opens this configuration.
CAN/LIN logs use ASC/BLF; UART uses .ulog and MeLiBu uses .mlog, each with its own source selection. Select an output folder and file-name rule, check the preview, and confirm. Start measurement and check the actual output path in Information. Stop flushes and closes logging.
New Loggers are enabled by default. Multiple Loggers can record CAN/LIN, UART and MeLiBu independently. Bus logging records CAN/LIN traffic rather than a selected ID.
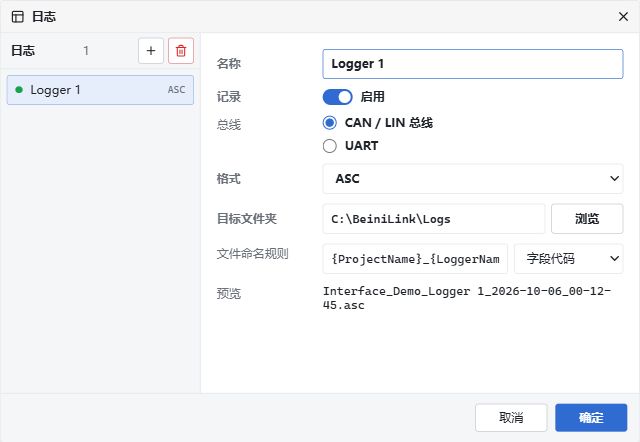
Logger example: enabled CAN / LIN ASC recording, with project name, Logger name and local time in the file name. Chinese UI.
Fields
| Field | Value |
|---|---|
{LocalTime} | Start time, such as 2026-10-05_16-30-00 |
{LoggerName} | Logger name |
{ProjectName} | Project name |
Example rule: {ProjectName}_{LoggerName}_{LocalTime}. The selected format supplies the extension. A rule without {LocalTime} still receives a YYYYMMDDHHmmss suffix. Empty rules and invalid filename characters cannot be saved; only the listed fields have substitutions.
Existing files are preserved using _1, _2, etc. Choose an explicit writable folder and use the path reported in Information.
Each Logger has its own folder. To keep ASC and BLF together, set both Loggers to the same folder.
Display versus recording
Trace pause, mouse scrolling, filtering, and clearing do not stop bus logging or delete written files. CSV export is a display export, not a complete capture.
Bus logging runs in the backend independently of the display cache. UART logging follows the UART data stream, not its display filter; actual processing capacity still applies. Logger creation/write failures appear in Information. Measurement starting does not prove every Logger started successfully.
MeLiBu logging uses a native writer queue and continues when the Trace window is paused, filtered, cleared or closed. .mlog uses ASC-like text: a short header, then one record per line with time in seconds, direction, event, ID, length and hex data. The suffix preserves CRC/ACK, transport status, time basis, session, sequence, raw bytes and truncation/drop flags. Unknown time is -, never a fabricated host timestamp. Different time bases or sessions are not directly comparable. Decoded MBDF signal objects and JSON are not written. Stop drains the queue.
UART .ulog records host delivery time in seconds from log start, channel, direction, length and hex data. This is not a hardware frame timestamp:
date 2026-11-02T08:00:00.000Z
base hex timestamps relative
0.001234 UART Rx d 3 11 22 33
0.002345 Uart2CAN Tx d 2 AA 55
Legacy UART/MeLiBu .log project settings migrate to .ulog/.mlog on opening; existing files are unchanged. Neither format is loaded through the ASC/BLF history viewer.